 Xenonstack Glossary
What are your key focus areas? *
AI Workflow and Operations
Data Management and Operations
AI Governance
Analytics and Insights
Observability
Security Operations
Risk and Compliance
Procurement and Supply Chain
Private Cloud AI
Vision AI

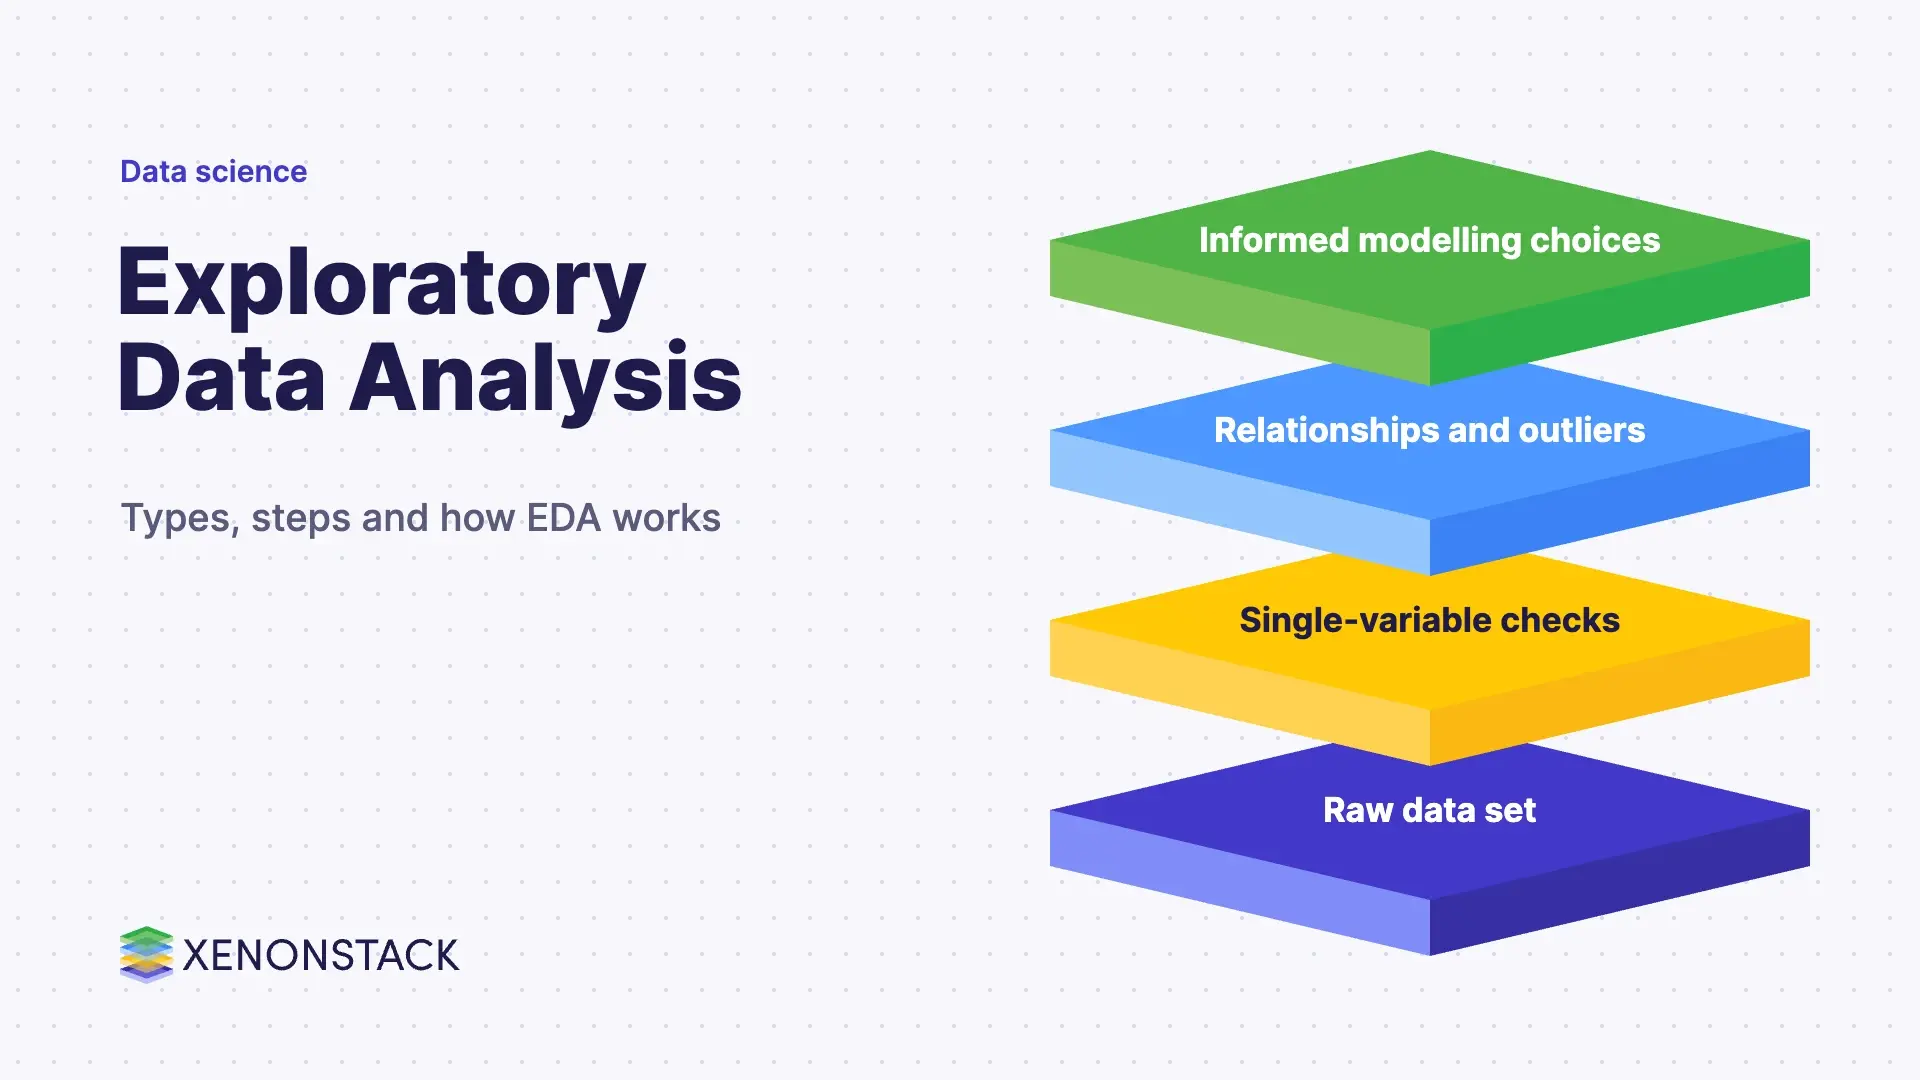
Exploratory data analysis (EDA) is an approach to analysing a data set, using mostly graphical techniques, to understand its structure, spot outliers and anomalies, and decide what to model before any assumptions are fixed. Analysts use visualisation and summary statistics to see what the data can reveal beyond formal modelling or hypothesis testing.
This page is for data scientists, analysts and data leaders who start projects from raw data. It covers what EDA is, its types and steps, how it differs from statistical graphics, and what to do first.
The NIST Engineering Statistics Handbook describes EDA as an approach and philosophy for data analysis that employs a variety of techniques, mostly graphical. Its goals include maximising insight into a data set, uncovering underlying structure, detecting outliers and anomalies, and developing parsimonious models. It adds that EDA postpones the usual assumptions about what kind of model the data follow, so the data can show its own structure.
IBM says EDA originated with John Tukey in the 1970s and is used to summarise a data set's main characteristics, often with data visualisation. It sits upstream of business analytics and modelling work.
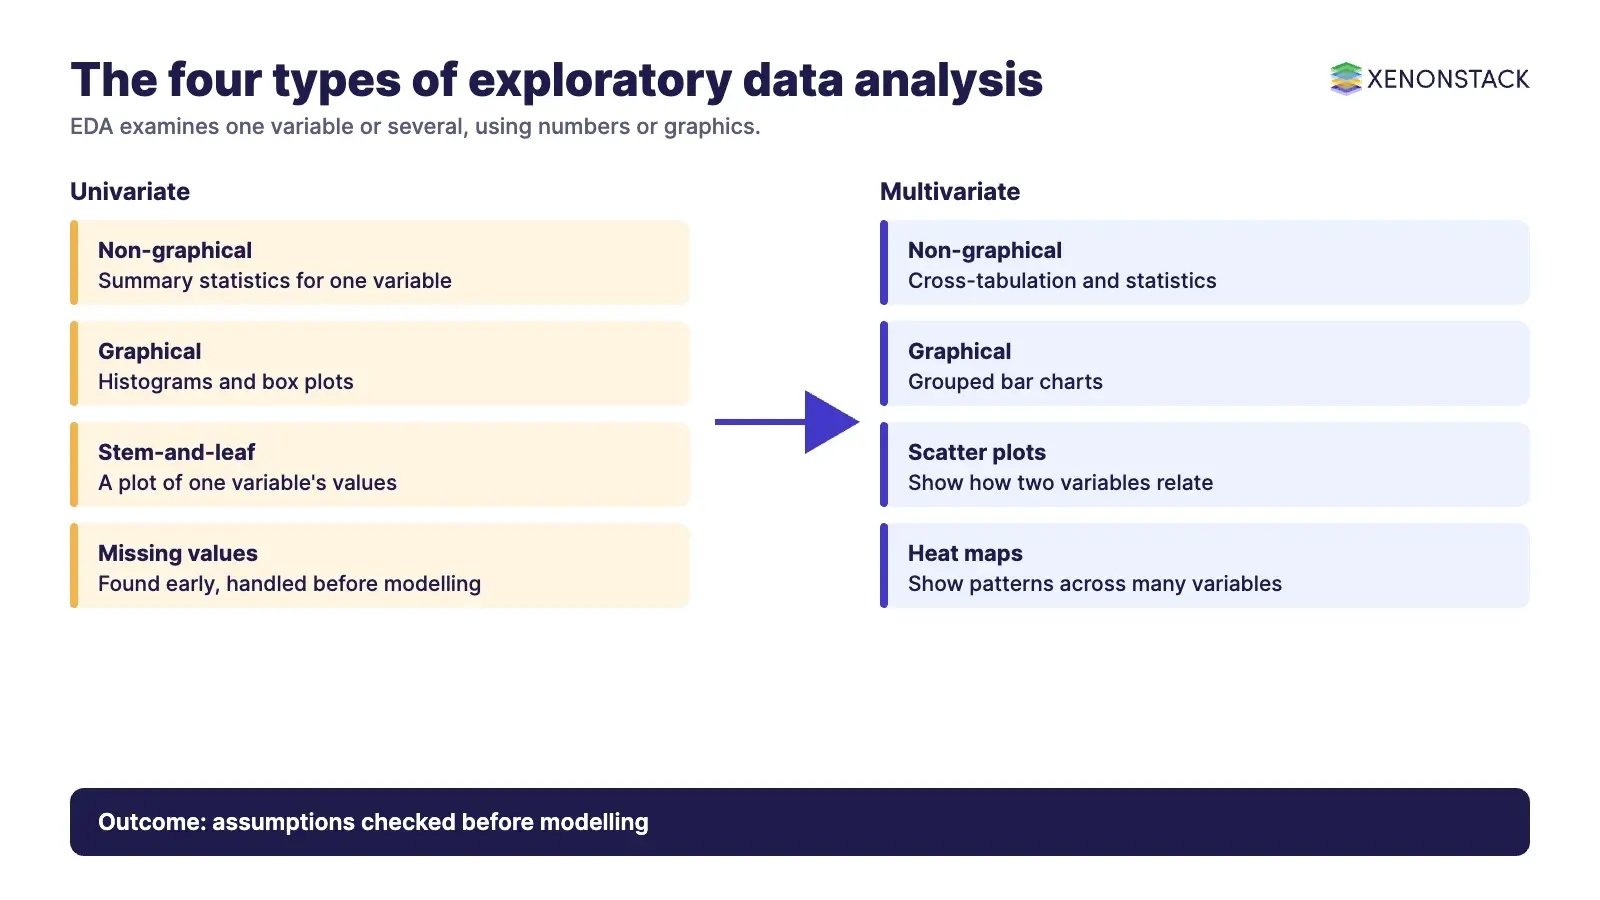
IBM lists four types, based on how many variables are examined and whether the methods are graphical.
| Type | What it examines | Typical methods |
|---|---|---|
| Univariate non-graphical | One variable, to describe it and find patterns | Summary statistics |
| Univariate graphical | One variable, shown visually | Stem-and-leaf plots, histograms, box plots |
| Multivariate non-graphical | Relationships among two or more variables | Cross-tabulation, statistics |
| Multivariate graphical | Relationships among two or more variables, shown visually | Grouped bar charts, scatter plots, heat maps |
There is no single fixed sequence, because NIST calls EDA a way of thinking rather than a collection of techniques. A common order is to identify each variable and its type, examine variables one at a time, then examine relationships between them. IBM also stresses finding missing values early, so that you can decide how to handle them before machine learning. For high-dimensional data it names clustering and dimension reduction, and it lists Python and R as widely used languages for EDA.
NIST says EDA is not identical to statistical graphics, although the two terms are used almost interchangeably. Statistical graphics is a set of techniques, each focused on one aspect of the data. EDA is broader and relies heavily on graphical techniques, with a few quantitative ones, to explore the data in an open-ended way.
| Question | EDA | Statistical graphics | Formal modelling or hypothesis testing |
|---|---|---|---|
| Starting point | The data, with model assumptions postponed | A chosen aspect of the data | A model or hypothesis fixed in advance |
| Scope | Broad, open-ended exploration | A set of plotting techniques | Tests a specific claim |
| Typical outcome | Structure, outliers, candidate models | A picture of one aspect | Support for or against the model |
IBM says the main purpose of EDA is to look at data before making any assumptions. That helps teams catch missing values, odd outliers and unexpected relationships before they reach a model, a report or a decision.
An agent is only as dependable as the data it reads, so EDA is a sensible check on the data an agent will rely on. Missing values and outliers found in EDA are decisions someone must own. ElixirData is XenonStack's Context OS, built for governed context across the data behind agent decisions.
To map one decision your agents make, and the data and policy it depends on, book a Context Workshop. See what happens in the workshop.
Exploratory data analysis is an approach to examining a data set, mostly with graphics, to understand its structure and spot outliers before building a model.
IBM says EDA originated with John Tukey in the 1970s.
Univariate non-graphical, univariate graphical, multivariate non-graphical and multivariate graphical.
No. NIST says the two are not identical: statistical graphics is a set of techniques, while EDA is a broader approach that relies heavily on graphical techniques.
Python and R are widely used for EDA, including for finding missing values.
Explore the XenonStack platform family: ElixirData · ElixirClaw · ElixirHub · NexaStack · MetaSecure · Neural AI · AgentGRC · AgentSRE · AgentAnalyst · AgentInstruct · AgentRAI · AgentScrum · AgentSearch · AgentForce · AI Aviator · SAIF Aviator · CohortIQ · XenonStack AI · XenonStack UAE
Tell us about you and your priorities so we can prepare the right conversation. It takes about 2 minutes.
AI continuously monitors systems for risks before they escalate. It correlates signals across logs, metrics, and traces. This ensures faster detection, fewer incidents, and stronger reliability
 Proactive detection of performance and availability issues
 Root-cause analysis across microservices and environments
 Automated remediation playbooks to reduce MTTR

AI converts camera feeds into instant situational awareness. It detects unusual motion and unsafe behavior in real time. Long hours of video become searchable and summarized instantly
 Real-time detection of suspicious motion or intrusion
 Natural language video search and instant playback
 Smart summaries for audits, investigations, and compliance

Your data stack becomes intelligent and conversational. Agents surface insights, detect anomalies, and explain trends. Move from dashboards to autonomous, always-on analytics
 Connects to warehouses, lakes, and streaming sources
 Question-answering in natural language
 Continuous monitoring for anomalies and KPI deviations

Agents identify recurring failures and performance issues. They trigger workflows that resolve common problems automatically. Your infrastructure evolves into a self-healing environment
 Automated diagnostics for recurring errors
 Playbook execution: restart services, scale pods, clear queues
 Feedback loop for improving remediation strategies

AI continuously checks controls and compliance posture. It detects misconfigurations and risks before they escalate. Evidence collection becomes automatic and audit-ready
 Continuous control checks across infrastructure and SaaS
 Automated evidence collection for audits
 Risk scoring and prioritized remediation recommendations

Financial and procurement workflows become proactive and insight-driven. Agents monitor spend, vendors, and contracts in real time. Approvals and sourcing decisions become faster and smarter
 Real-time visibility into spend and commitments
 Anomaly detection on invoices and vendor performance
 Intelligent workflows for approvals and sourcing decisions


