Key takeaway
- Databricks data quality monitoring explained: anomaly detection, data profiling, alerts and expectations, plus permissions, cost and rollout steps.
Databricks data quality monitoring now means two Unity Catalog features working together: anomaly detection, which watches table freshness and completeness across a whole schema, and data profiling (formerly Lakehouse Monitoring), which tracks statistics, drift and custom metrics on chosen tables and model logs. Neither replaces rule-based checks in your pipelines, so most enterprises combine all three.
This guide is for CTOs, CDOs and platform leads deciding what to switch on, what it costs and what it will not catch. It builds on our notes on why data quality matters, common data quality issues and data pipeline architecture, and on our Databricks practice.
Which Databricks feature should you use for data quality monitoring?
Match the feature to the question you are asking. Statuses are as stated in the Databricks documentation read on 12 November 2026.
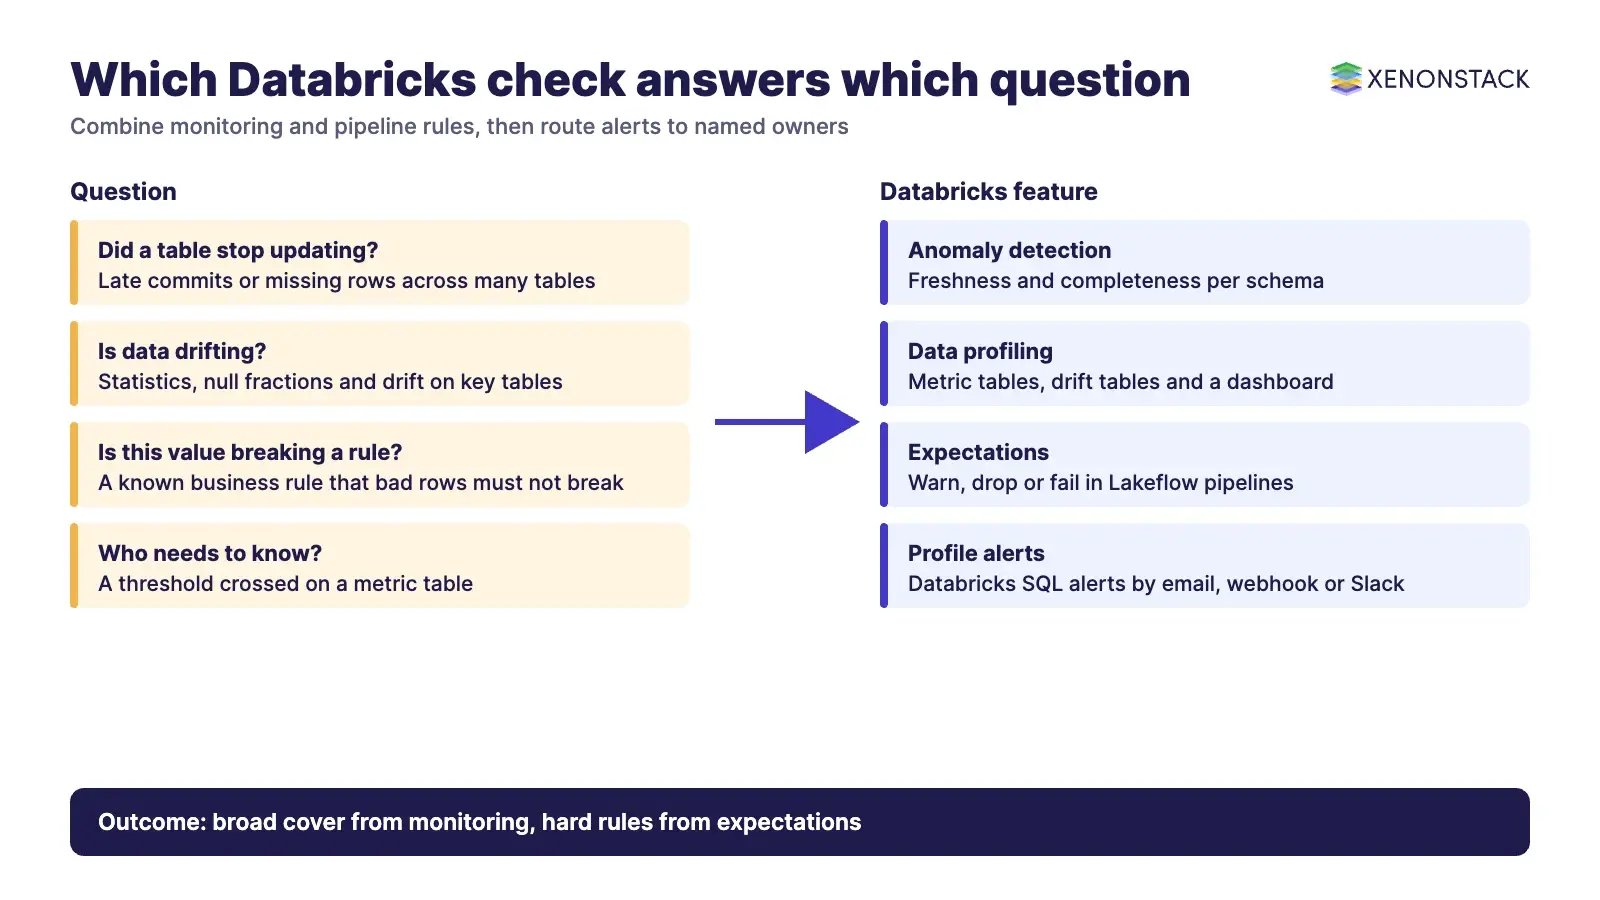
| Feature | What it watches | When it fits | Current notes |
|---|---|---|---|
| Anomaly detection (data quality monitoring) | Freshness and completeness of tables across a schema | You have many tables and need broad cover without writing rules | Enabled per schema or catalog; percent null, completeness slicing and recently resolved incidents are described as beta; event freshness is not supported |
| Data profiling (formerly Lakehouse Monitoring) | Summary statistics, drift, null and zero fractions, custom metrics; snapshot, time series and inference profiles | You need depth on critical tables, feature tables or model inference logs | Two Delta metric tables plus an auto-created dashboard; time series and inference metrics cover the last 30 days by default; snapshot profiles are capped at 4TB |
| Expectations in Lakeflow pipelines | Row-level rules you define, with warn, drop or fail actions | You know the rule and want to stop bad rows entering a table | Metrics appear in the pipeline Data quality tab and event log; fail actions record no metrics because the update fails |
| Profile alerts (Databricks SQL alerts) | Queries on the profile metric and drift tables | You want a named owner notified on a threshold you set | Notifications by email by default, plus webhook, Slack or PagerDuty |
Source: Databricks anomaly detection, data profiling and pipeline expectations documentation.
What has changed in Databricks data quality monitoring?
- Renamed: Databricks lists data profiling as formerly Lakehouse Monitoring, under the umbrella name data quality monitoring. Update runbooks and architecture diagrams that still use the old name.
- New results experience: a new Data Quality Monitoring UI was released on 7 October 2025. Schemas enabled on or after that date use it automatically, and Databricks recommends toggling the feature off and on to move older schemas across.
- Legacy configuration retired: the legacy dashboard and job-parameter configuration are no longer part of the current version, and job-parameter configuration has not been supported for new customers since 21 July 2025.
- Central visibility: account and metastore admins can see the share of healthy tables on the Data page in Governance Hub.
One correction to older advice: Databricks documents statistical models of table behaviour, not autonomous agents that repair data. Any automated remediation is something your team builds on top, and it should be governed as such.
How does anomaly detection work, and what will it miss?
What it checks
For freshness, Databricks models each table's commit history to predict the next commit, and a commit that is unusually late marks the table as stale. For completeness, it compares rows written in the last 24 hours with a predicted lower bound. Scans follow how often each table is updated, and intelligent scanning prioritises high-impact tables and scans less critical ones less often.
What it does not cover
Completeness does not account for null fractions, zero values or NaN. Event freshness is not supported. Smart scanning can delay health indicators for skipped tables by up to two weeks, and you can exclude tables through the Create or Update Monitor API. It will not tell you that a value is wrong against a business rule, which is why expectations and data profiling remain necessary.
Where results appear
Health indicators (Healthy, Unhealthy, Training, Error, Excluded, Not enabled) show in Catalog Explorer. Incident views show status, reason, root cause and impact. Logged results are written to system.data_quality_monitoring.table_results, so you can query them or feed them to your own reporting. Databricks says the root_cause_analysis column is being deprecated from 18 August 2026 and downstream_impact from 7 September 2026, after which neither is populated.
How should alerts and ownership work?
Anomaly detection lets you switch on alerts when you enable a schema and choose who is notified when a table becomes unhealthy; alerts include root cause information. For data profiling, write a query on the profile metrics or drift metrics table and create a Databricks SQL alert on it, with an evaluation frequency and a notification channel. Give each critical table a named owner, because an alert nobody owns is the same failure as no alert. If you want plain-language questions on top of the results, AgentAnalyst lets teams ask questions of enterprise data in plain language and get real-time insights, governed by ElixirData Context OS.
What do governance, security and cost look like?
| Area | What the documentation says | What to decide |
|---|---|---|
| Permissions | Enabling anomaly detection needs MANAGE on the schema or parent catalog; viewing a health indicator needs SELECT on the table or BROWSE on the catalog; data profiling needs USE CATALOG, USE SCHEMA, SELECT and MANAGE | Who may enable monitoring and who may read results |
| Compute and cost | Runs on serverless compute and is billed as serverless DBUs under the DATA_QUALITY_MONITORING billing product; cost depends on the number and size of tables and how often they are evaluated | Which schemas justify monitoring; track spend in the billing data |
| Impact on data | Monitoring does not modify the monitored tables and adds no overhead to the jobs that populate them | Nothing to change in pipelines to start |
| Reversibility | Disabling anomaly detection deletes its job, tables and information, and this cannot be undone | Export results you need before switching off |
| Catalog scale | Up to 50 schemas can be enabled at once from a catalog; schemas added later are not enabled automatically | A process to enable new schemas |
Source: Databricks data quality monitoring overview. Where monitored data feeds AI decisions, ElixirData Context OS keeps governed context, versioned policy and decision traces in one decision layer above AI agents.
When is Databricks monitoring not enough?
- Business rules: a statistical model of freshness and row counts cannot know that a discount field must never exceed 100. Use expectations in the pipeline for these.
- Non-Databricks sources: monitoring covers Unity Catalog tables. Upstream systems and downstream reports need their own checks.
- Cost on very wide estates: monitoring every schema at high refresh rates adds serverless spend, so start with the tables that feed revenue, regulatory or model decisions.
- Model quality: inference profiles track data and model metrics, but judging whether an AI agent's decision was right needs decision-level review. Our guides on self-optimising inference pipelines on Databricks and removing data silos with AI in Databricks cover the surrounding architecture.
What should you plan for in 2027?
Treat data quality monitoring as a rollout that you widen in stages, rather than a switch you flip once.
- Start narrow and name owners. Enable anomaly detection on one high value schema with alerts on, and give each alert a named owner before adding more schemas.
- Keep the layers together. Anomaly detection, data profiling and pipeline expectations catch different problems, so add profiling and expectations where drift or known business rules matter.
- Review cost and status every cycle. Check serverless spend under the DATA_QUALITY_MONITORING billing product, and re-read the Databricks documentation, because feature names and beta statuses have already changed once.
In what order should you adopt it?
- Confirm Unity Catalog and serverless availability, and agree who holds MANAGE on each schema.
- Enable anomaly detection on one high-value schema with alerts on, and name an owner for each alert.
- Add data profiling to the few tables or inference logs where drift matters, and build Databricks SQL alerts on the metric tables.
- Add expectations in pipelines for rules you know, using warn first, then drop or fail where bad rows must never land.
- Review billing for the DATA_QUALITY_MONITORING product after a full cycle, then widen to more schemas.
To map one data quality decision your agents depend on, and the context and policy behind it, book a Context Workshop. See what happens in the workshop. For agent-led operations around your data estate, see ElixirClaw, an agentic OS platform to build, orchestrate and govern AI agents and automation workflows while keeping humans in control.
Frequently asked questions
Is Lakehouse Monitoring still a Databricks product?
Databricks now lists it as data profiling, within data quality monitoring. Use the new name in documentation and internal standards.
What does Databricks anomaly detection check?
Freshness, meaning whether a table was updated when its commit history predicts, and completeness, meaning whether rows written in the last 24 hours fall below a predicted lower bound.
Where are anomaly detection results stored?
In system.data_quality_monitoring.table_results, with health indicators in Catalog Explorer and incident details in the results UI.
How is data quality monitoring billed?
It runs on serverless compute and is billed as serverless DBUs under the DATA_QUALITY_MONITORING billing product, depending on the number and size of tables and how often they are evaluated.
Can I send alerts to Slack or PagerDuty?
For data profiling, yes. Profile alerts are Databricks SQL alerts, which notify by email by default and can also use webhooks or tools such as Slack and PagerDuty.
Do expectations replace monitoring?
No. Expectations enforce rules you define with warn, drop or fail actions. Monitoring finds problems you did not write a rule for, such as a table that stopped updating.
Follow XenonStack on LinkedIn: XenonStack on LinkedIn for new guides on agentic AI, data and platform engineering.
Explore the XenonStack platform family: ElixirData · ElixirClaw · ElixirHub · NexaStack · MetaSecure · Neural AI · AgentGRC · AgentSRE · AgentAnalyst · AgentInstruct · AgentRAI · AgentScrum · AgentSearch · AgentForce · AI Aviator · SAIF Aviator · CohortIQ · XenonStack AI · XenonStack UAE