Key takeaway
- Predictive analytics for consumer goods supply chains: demand, inventory, supplier and logistics decisions, forecast accuracy measures and first steps.
Predictive analytics in a consumer goods supply chain uses historical and current data, statistical models and machine learning to estimate what is likely to happen next, such as demand, delays or supplier problems, so planners can act before it does. It does not remove uncertainty, it makes uncertainty measurable.
This guide is for supply chain, planning and data leaders in consumer goods companies. It explains how a predictive model is built, where it supports decisions across the chain, how to measure forecast accuracy, what blocks adoption, and how AI agents turn a forecast into an action. For the wider topic, see our guide to predictive analytics.
What is predictive analytics in a supply chain?
The Google Cloud guide to predictive analytics defines it as a branch of data science that uses historical data, statistical modeling and machine learning to answer the question "What might happen next?" In a supply chain, that question is asked about demand by product and region, stock levels, supplier delivery, transport times and external shocks.
Consumer goods make the problem hard because demand shifts with season, promotions, weather and consumer behaviour, while products have short shelf lives and many points of sale. Models draw on big data platforms and artificial intelligence techniques to find patterns that spreadsheets and fixed rules miss.
How does a predictive model get built and run?
The same Google Cloud guide describes five steps, and each maps cleanly onto a supply chain project.
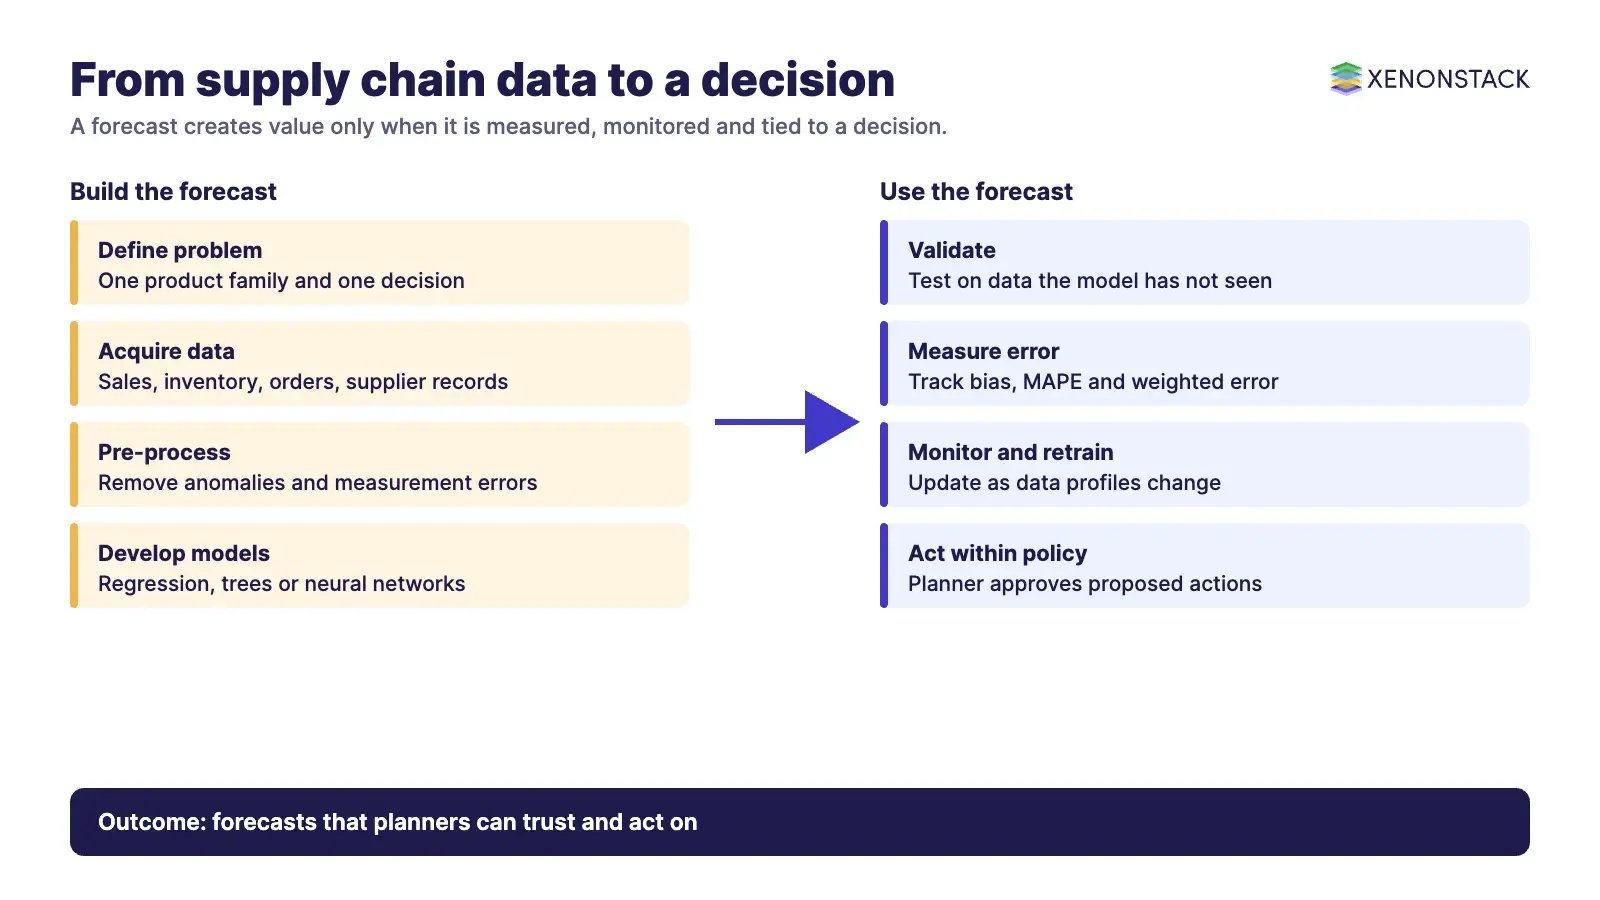
- Define the problem: for example, forecast weekly demand per product and region.
- Acquire and organise data: sales history, inventory, orders, supplier records and external signals.
- Pre-process data: clean raw data to remove anomalies or measurement errors that could skew the model.
- Develop models: the guide names regression, decision trees and neural networks as common techniques.
- Validate and deploy: keep checking model accuracy and deliver results through applications or dashboards.
Where does predictive analytics help across the supply chain?
Each area below pairs a decision with the data that informs it. Start with the decision, not the model.
| Area | Typical data | Decision it supports |
|---|---|---|
| Demand forecasting | Sales history, promotions, calendar events, weather | How much to make and ship, by product and region |
| Inventory optimisation | Stock levels, lead times, forecast error | When and how much to replenish, and where to hold stock |
| Supplier performance | Delivery dates, quality records, defect rates | Which suppliers to rely on and where delays are likely |
| Transport and logistics | Shipment history, routes, traffic and weather | Which routes and schedules to plan |
| Risk and disruption | Port, strike and geopolitical signals, supplier concentration | Which contingency plans to prepare |
| Sustainability | Route and load data, order patterns | Where to cut empty miles and waste |
Why do consumer goods companies need it?
The business case follows from the decisions above. Better demand signals help avoid both stockouts and overstock. Earlier warning of supplier or route problems leaves time to respond. Fewer expedited shipments and less write-off from unsold stock follow from planning against measured uncertainty. Treat these as hypotheses to test on your own data, not as promised results.
How do you measure forecast accuracy?
Accuracy must be measured on data the model has not seen. In its Dynamics 365 documentation, Microsoft separates historical forecast accuracy, which compares the forecast used for planning with actual demand, from the estimated accuracy of the forecasting model, and gives an example in which the last 20 percent of the history is held back to calculate internal model accuracy. The AWS Prescriptive Guidance on forecast error defines several measures.
| Measure | What it tells you | Source wording |
|---|---|---|
| Bias | Whether the forecast is consistently too high or too low | A consistent error that causes a forecast to be either too high or too low |
| MAPE | How many percentage points the forecasts are off, on average | AWS says it might be the most commonly used forecasting metric when planning demand |
| WMAPE | Error weighted by actual demand, so priority items count more | AWS notes MAPE ignores differences in priority between products |
Use more than one measure. A model with a low average error can still be biased, and an average can hide a poor result on the products that matter most.
Which technologies feed the forecasts?
- Machine learning and AI: models that learn from new data, and language models that read news and supplier reports for early signals.
- Data integration: IoT sensor data, ERP records and external data such as weather.
- Cloud computing: elastic capacity to prepare data and run models at scale.
- Digital twins: simulated models of the supply chain used to test a decision before you make it.
- Edge analytics: models that run close to sensors on production lines or vehicles when a decision cannot wait.
What gets in the way of adoption, and what helps?
| Barrier | What helps |
|---|---|
| Poor or inconsistent data | Regular data audits, clear ownership and quality checks before training |
| Systems that do not connect | Shared data platforms and agreed interfaces to ERP and planning tools |
| High upfront cost | Start with one product family and expand once accuracy is proven |
| Resistance to change | Involve planners early, show forecast error openly, train teams |
Models also go stale. The Google Cloud MLOps guide explains that production data profiles keep changing, so you should monitor model quality and retrain on recent data. Plan that work from day one.
How do AI agents change predictive analytics in supply chains?
A forecast is only useful when someone acts on it. AI agents can watch forecast error, compare plans with actual orders, draft a replenishment or rerouting proposal and route it to a planner, within limits you define. The agent needs the right data, the policy that bounds its actions and a record of each decision. ElixirData is XenonStack's Context OS for governed data and decision context, and it is where this layer sits in a data and analytics architecture.
What should you do first?
- Pick one product family and one decision, such as weekly replenishment.
- Measure your current forecast error and bias before changing anything.
- Fix the data problems that most distort that forecast.
- Hold back recent data to test any new model honestly.
- Decide who approves actions, and how forecast results and decisions are logged.
To map one supply chain decision your agents make, and the data and policy it depends on, book a Context Workshop. See what happens in the workshop.
Frequently asked questions
What is predictive analytics in the supply chain?
It uses historical and current data, statistical models and machine learning to estimate future demand, delays and risks so planners can act earlier.
Which forecast accuracy measures should I track?
Track bias, MAPE and a weighted measure such as WMAPE together, because an average error can hide consistent over-forecasting or poor results on priority products.
How much data do I need to start?
Enough sales and inventory history to cover your seasons and promotions, cleaned of errors. Start with one product family and test on recent data the model has not seen.
Why do forecasting models need retraining?
Production data changes over time, so model quality can fall. Monitor accuracy in production and retrain on recent data.
How do AI agents use a demand forecast?
They monitor forecast error against actual orders and draft actions such as replenishment proposals for a planner to approve, within policy limits you set.
Follow XenonStack on LinkedIn: XenonStack on LinkedIn for new guides on agentic AI, data and platform engineering.
Ready to put AI agents to work? Explore ElixirClaw, the agentic OS platform to build, orchestrate and govern AI agents.
Explore the XenonStack platform family: ElixirData · ElixirClaw · ElixirHub · NexaStack · MetaSecure · Neural AI · AgentGRC · AgentSRE · AgentAnalyst · AgentInstruct · AgentRAI · AgentScrum · AgentSearch · AgentForce · AI Aviator · SAIF Aviator · CohortIQ · XenonStack AI · XenonStack UAE