Key takeaway
- Learn how to detect anomalies in time series: components, anomaly types, statistical, ML and LSTM methods, tool status and a production checklist.
Time series anomaly detection finds observations, or runs of observations, that do not fit the pattern a series normally follows: its trend, its seasonality and its usual noise. The practical route is to model what normal looks like, score each new point against that model, and alert when the gap is larger than you can tolerate. Statistical methods suit stable, seasonal series; machine learning and deep learning earn their cost when there are many signals, shifting behaviour or no labelled examples.
This guide covers the components of a time series, the types of anomaly, the main detection methods with their current status, what deep learning does and does not add, and how to run detection in production. For the wider forecasting toolkit, see time series analysis and machine learning models and forecasting types and methods.
What is a time series, and what counts as an anomaly?
A time series is a set of observations of the same quantity taken in time order, usually at regular intervals: sensor readings, application telemetry, click streams, stock prices or login counts. Because neighbouring values depend on each other, ordinary tabular methods that shuffle rows can mislead. Time series data differs from cross-section data, which records many variables at a single point in time, for example sales revenue and sales volume for one month across stores. Series are often split into a historical (training) period and a later validation period, so the model is always tested on data that comes after what it learned from.
An anomaly is an observation that deviates from expected behaviour. As an illustration, if an account usually sees withdrawals of Rs 10,000 and one day Rs 6,00,000 leaves it, that single value is unusual against the whole history. There are three common types:
| Type | What it means | Example |
|---|---|---|
| Point anomaly | One value is unusual against the whole series | A single very large bank withdrawal |
| Contextual anomaly | A value is normal in general but unusual for its time or context | A traffic spike at 3 a.m. that would be normal at noon |
| Collective anomaly | A group of values is unusual together, even if each value looks fine alone | A break in the normal shape of an ECG trace |
What are the components of a time series?
Anomaly detection starts by separating what is expected from what is not. According to Forecasting: Principles and Practice (3rd ed.), a series can be split into a trend-cycle (the overall movement, ignoring seasonality and random fluctuation), a seasonal component that repeats at a fixed, known period (for example 12 for monthly data) and a remainder. The remainder is where anomalies usually show up.
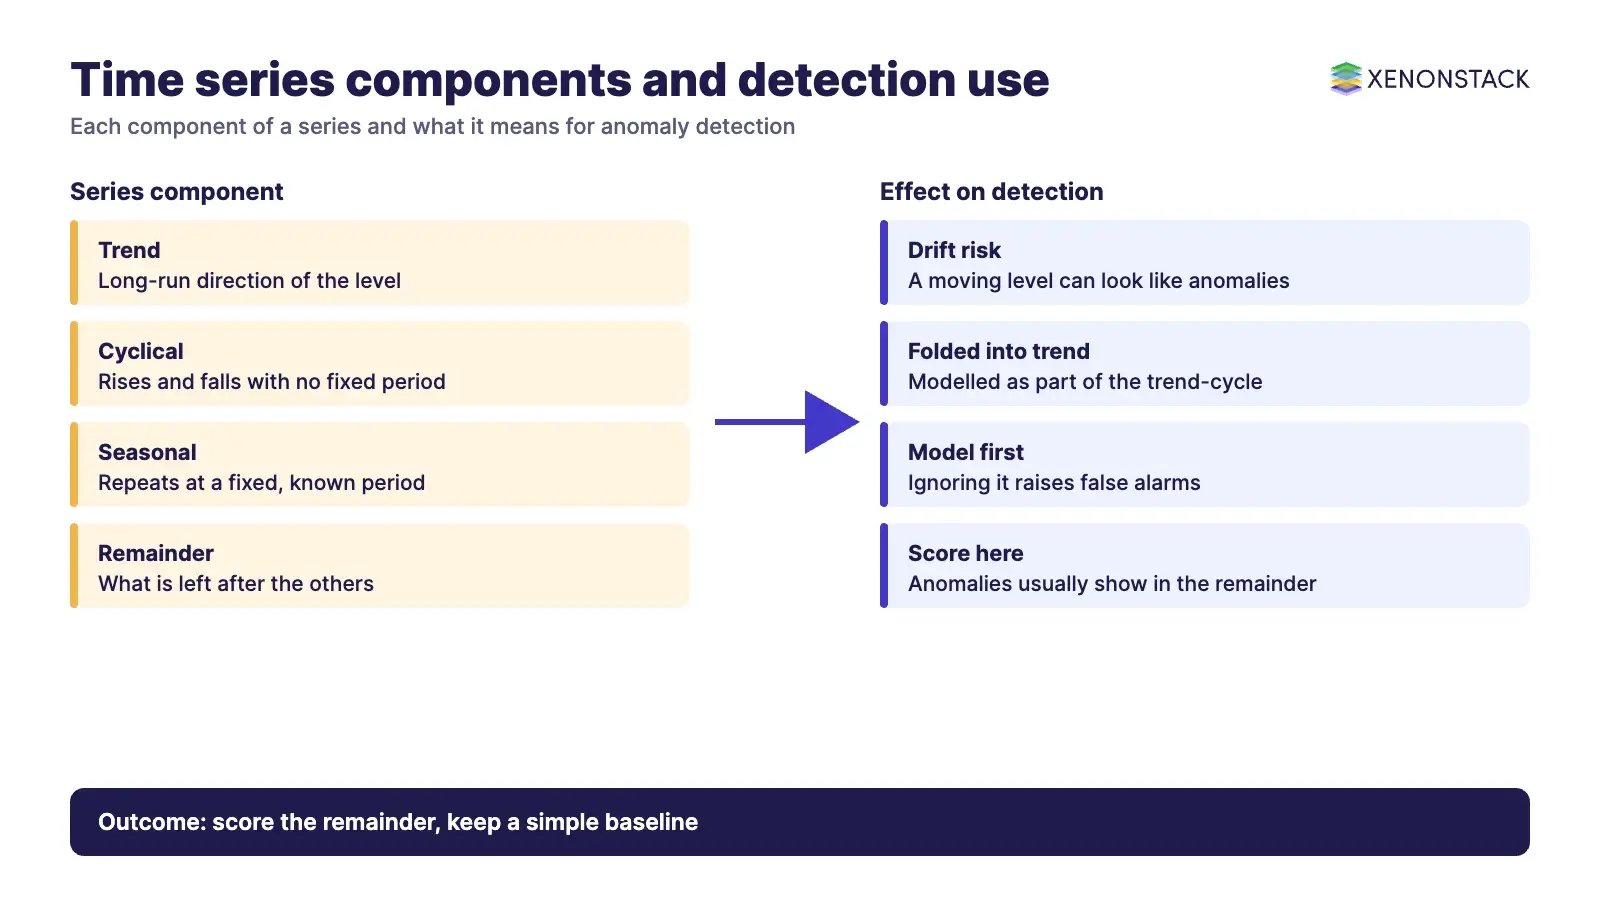
| Component | What it describes | Why it matters for detection |
|---|---|---|
| Trend | Long-run direction, upward, downward or flat | A drifting level can look like a stream of anomalies if the model assumes a flat mean |
| Cyclical | Rises and falls with no fixed period, tied to business or economic cycles | Period is not fixed, so it is usually folded into the trend-cycle rather than modelled separately |
| Seasonal | Regular pattern at a fixed, known period, driven by calendar, climate or habit | Ignoring it flags every Monday peak as unusual |
| Irregular (remainder) | What is left after trend and seasonality are removed | Scoring this residual is the basis of many detectors |
Decomposition can be additive (trend + seasonal + remainder), which fits when seasonal swings stay roughly constant, or multiplicative (trend x seasonal x remainder), which fits when swings grow in proportion to the level. Choosing the wrong form leaves seasonal structure in the residual and raises false alarms.
Which anomaly detection method fits which problem?
There is no single best detector. The right choice depends on whether you have labels, how many signals you monitor, and how stable the pattern is. The table lists the methods most teams meet, with a plain statement of status where we could check it.
| Method | How it works | Fits when | Watch for |
|---|---|---|---|
| Seasonal Hybrid ESD (S-H-ESD) | Builds on the Generalised ESD test, using decomposition and robust statistics (median) to flag local and global anomalies despite seasonality and trend | One seasonal univariate series, no labels | The Twitter package that popularised it is archived and read-only on GitHub (archived 13 Nov 2021); treat it as a method to reimplement or replace, not a maintained dependency |
| Principal component analysis (PCA) | Learns a "normal" subspace from the available features and flags points far from it | Many correlated features, few labelled anomalies | Distance thresholds need tuning; dimensionality reduction does discard some information |
| Chi-square or ESD style tests | Statistical tests on residuals to find outliers on either side of the distribution | Univariate checks and a quick baseline | Assume the residual distribution is well behaved |
| Supervised learning (kNN, SVM, decision trees, Bayesian networks) | Classifies points as anomalous or normal from labelled examples | You hold enough labelled anomalies | Labelled anomalies are rare, so classes are heavily imbalanced |
| Unsupervised learning (k-means, self-organising maps, one-class SVM, expectation-maximisation) | Learns normal behaviour and flags what sits far from it | No labels, many signals | Needs a threshold policy and periodic re-tuning |
| Recurrent networks (LSTM) and autoencoders | Learn temporal dependence; flag points where prediction or reconstruction error is high | Multi-sensor, non-linear, long-memory series, with enough clean history | Heavier to train, monitor and explain; see the next section |
Where does deep learning help, and where does it not?
A recurrent neural network keeps an internal state that is updated as each new input arrives, so it can learn time-dependent features without hand-built lags. For anomaly detection the usual pattern is to train on normal data only, because abnormal data is scarce, then flag inputs the network predicts or reconstructs poorly. A published example is the LSTM encoder-decoder for multi-sensor anomaly detection (EncDec-AD) by Malhotra and colleagues, described in arXiv:1607.00148. It trains the network to rebuild normal sensor behaviour and treats a large reconstruction error as an anomaly signal. The authors tested it on three public datasets and two engine datasets.
Deep models are not automatically better. In the TensorFlow time series tutorial, which compares baselines, linear, dense, convolutional and LSTM models on a weather series, the authors conclude that the gains from dense to convolutional and recurrent models are only a few percent, if any, and that the autoregressive LSTM performed clearly worse than the single-shot models. The tutorial also splits the data in time order, not randomly. The lesson for enterprise teams is to keep a simple baseline in every evaluation and to adopt a deep model only when it beats that baseline on your own held-out, later-in-time data.
What are breakouts, and how do they differ from anomalies?
A breakout is a lasting change in the series rather than an isolated odd value. Two shapes are common. A mean shift is a sudden move from one steady level to another, for example average CPU use jumping from 35% to 70% and staying there. A ramp up is a gradual transition between two steady states. Point detectors alert once on a mean shift and then adapt, whereas a change-point method is designed to report the moment the level changed. Decide up front which you need: an alert on the odd value, or an alert on the new normal.
How should you visualise a series before choosing a detector?
Plot first. Line plots show trend and level shifts; histograms, density plots and box-and-whisker plots show the shape of the values; heat maps expose daily or weekly patterns; lag plots and autocorrelation plots show how strongly a value depends on earlier ones and help you choose the seasonal period. The same charts work for multivariate series when several signals move with time, and they often reveal whether a statistical test will be enough before any model is trained. See our guide to time series forecasting with deep learning for a worked forecasting approach.
Which tools and databases support time series anomaly detection today?
Storage and tooling have changed, so check status before committing. Time series databases such as InfluxDB, Graphite, OpenTSDB, CrateDB, Kx kdb+ and others are built for high-volume timestamped writes and range queries that relational systems handle poorly at scale; our note on time-series databases in real-time analytics compares them with relational stores. On the managed-service side, the Azure AI Anomaly Detector overview page states that new resources could not be created after 20 September 2023 and that the service is being retired on 1 October 2026, and it recommends migrating to Microsoft Fabric or the open-source anomaly-detector project. Microsoft Fabric Real-Time Intelligence anomaly detection was described as a preview feature on its Microsoft Learn page when we read it. Confirm both statuses on Microsoft Learn before you design around them. For streaming and operations use cases, see real-time anomaly detection for cognitive intelligence.
How do you run anomaly detection in production with governance and cost under control?
Detection is only useful if someone acts on it. Treat each alert as a decision with an owner, a threshold, a response and a record. A few controls keep this manageable:
- Thresholds and ownership: set alert thresholds per signal with a named owner, and review them when seasonality or the business changes.
- Drift and retraining: monitor the share of alerts that turn out to be real; a rising false-alarm rate is usually a sign the model or the baseline has aged.
- Human review for consequential actions: route high-impact alerts, such as blocking a payment, to a person, and keep the evidence the model used.
- Cost: scoring every signal with a heavy model is expensive; screen with cheap statistical checks and send only flagged series to a deeper model.
- Decision records: keep versioned policy and decision traces so an alert can be explained later. ElixirData Context OS keeps governed context, versioned policy and decision traces in one decision layer above AI agents, and AgentAnalyst lets teams ask questions of enterprise data in plain language and get real-time insights.
What is a sensible adoption sequence?
- Define the anomaly you care about (point, contextual, collective or breakout) and the cost of a miss versus a false alarm.
- Plot and decompose the series, and set a seasonal baseline with a simple statistical detector.
- Split data in time order and measure any new model against that baseline on later data.
- Add machine learning or deep learning only where the baseline fails, for example many correlated signals.
- Wire alerts to owners, with thresholds, review and a record of each decision.
- Re-evaluate on a schedule, and confirm vendor product status before relying on a managed service.
When should you not use deep learning for anomaly detection?
Skip it when the series is short, the pattern is stable and seasonal, you cannot hold out later data for testing, or you cannot explain an alert to the people who must act on it. In those cases a decomposition with a robust statistical test is cheaper, faster to audit and often just as accurate.
Video: anomaly detection with time series forecasting
XenonStack video: anomaly detection with time series forecasting.
To map one anomaly decision your agents should make, and the context and policy it depends on, book a Context Workshop. See what happens in the workshop.
Frequently asked questions
What is time series anomaly detection?
It is the process of finding values or sequences that deviate from the normal pattern of a series, usually by modelling trend and seasonality and scoring how far new observations fall from what the model expects.
What are the main types of anomaly in a time series?
Point anomalies (one unusual value), contextual anomalies (unusual for their time or context) and collective anomalies (a group of values unusual together). Breakouts, such as mean shifts and ramp ups, are lasting changes in level.
Is deep learning better than statistical methods for anomaly detection?
Not automatically. In the TensorFlow time series tutorial the gains from convolutional and recurrent models over a dense model were only a few percent, if any. Use a simple baseline and adopt deep learning only when it wins on later, held-out data.
Which tools are available, and are any retired?
Time series databases such as InfluxDB and OpenTSDB store the data. The Azure AI Anomaly Detector page states retirement on 1 October 2026 and recommends Microsoft Fabric or the open-source project; the Twitter AnomalyDetection package is archived on GitHub. Confirm current status on the vendor pages.
How do you reduce false alarms?
Model seasonality before scoring, tune thresholds per signal, route high-impact alerts to a person and track the share of alerts that prove real, retraining when that share falls.
Follow XenonStack on LinkedIn: XenonStack on LinkedIn for new guides on agentic AI, data and platform engineering.
Ready to put AI agents to work? Explore ElixirClaw, the agentic OS platform to build, orchestrate and govern AI agents.
Explore the XenonStack platform family: ElixirData · ElixirClaw · ElixirHub · NexaStack · MetaSecure · Neural AI · AgentGRC · AgentSRE · AgentAnalyst · AgentInstruct · AgentRAI · AgentScrum · AgentSearch · AgentForce · AI Aviator · SAIF Aviator · CohortIQ · XenonStack AI · XenonStack UAE