
.webp?width=1921&height=622&name=usecase-banner%20(1).webp)
How Has Analytics Evolved in the Last Decade?
Around ten years ago, analytics tools were limited to Excel, SQL databases, and relatively simple reporting systems. Analytics focused mainly on:
- Reporting
- Customer classification
- Sales trend analysis
As data volume increased due to social media, transactions, and sensor streams, traditional SQL systems became insufficient.
NoSQL databases replaced traditional SQL databases. Analytics shifted from serialized processing to parallel and distributed systems to deliver faster insights.
This transformation laid the foundation for modern Real-Time Anomaly Detection systems.
Key Takeaways
- An anomaly is any unexpected deviation from a normal trend — server downtime, data leaks, fraud transactions, and network intrusions are common enterprise examples.
- Real-time detection requires cognitive intelligence: adaptive, contextual, and continuously learning systems.
- Three detection approaches exist: supervised (labelled historical data), unsupervised (clustering — detects unknown anomalies), and deep learning (RNNs for time-series).
- Detection alone is insufficient — correlation analysis identifies root causes; predictive modelling (Bayesian, Markov) prevents future anomalies.
- A production anomaly detection platform requires five pillars: Data Collection, Aggregation, Visualisation, Alerting, and Analytics.
Simulate the human thought process to learn from the data and extract the hidden patterns from data. Click to explore about, Cognitive Analytics Tools and its Applications
What is Big Data Analytics in the Context of Real-Time Anomaly Detection?
As time passed by, the amount of data exploded with various factors like social media data, transaction records, sensor information, etc., in the past five years. With the increase in data, how data is stored has also changed. It used to be SQL databases the most, and analytics used to happen for the same during the ideal time.
The analytics also used to be serialized. Later, NoSQL databases started to replace traditional SQL databases since the data size had become huge, and the analysis also changed from serial analytics to parallel processing and distributed systems for quick results.
What is Cognitive Analytics and How Does It Support Real-Time Anomaly Detection?
Cognitive Analytics aims to simulate the human thought process to learn from data and extract hidden patterns.
Modern analytics focuses on:
- High-accuracy predictions
- Real-time output
- Continuous learning
- Human-like reasoning
Cognitive intelligence enables systems to predict future anomalies instead of only detecting past events.
What Are the Layers of Cognitive Intelligence in Real-Time Anomaly Detection?
Cognitive Computing helps accelerate human intelligence through human Learning, thinking, and adaptivity. Moving towards machine capacity not only helps augment human potential but also increases the individual's creativity and creates new waves of innovations. The key areas of capability are -
1. Sensory Perception
Machines can stimulate human senses such as smell, touch, taste, and hearing. Therefore, they are developed in machine simulation, such as visual and auditory perception.
2. Deduction, Reasoning, and Learning
In this case, the machines are simulated with human thinking for decision-making. Therefore, various technologies such as machine learning, Deep Learning, and neural networks are deployed as a system of intelligence to extract meaningful and useful information and apply judgment.
3. Data processing
This larger dataset is accessed to facilitate the decision-making process and provides practical suggestions. Therefore, hyperscale-computing, knowledge representation, and natural language processing provide the required processing power to enable the system to engage in real-time.
If you don’t want the future technologies to catch you off guard, pay attention to these current trends in big data analytics and succeed!”. Click to explore about, Latest Trends in Big Data Analytics
What Are the Core Features of Cognitive Computing Solutions?
The purpose of cognitive computing is to create a framework for computing so that complex problems can be solved easily without human intervention. Features are listed below -
-
Adaptive: One of the first steps in developing the machine learning-based cognitive system. The solution is to imitate the human ability to learn from one's surroundings. It is dynamic for data gathering, understanding goals and requirements.
-
Interactive: The cognitive solution should dynamically interact bidirectionally with each system element, such as processes, devices, users, and cloud services. The system can understand human input and provide the results using natural language processing and deep learning models.
-
Iterative and Stateful: The system should be able to learn from previous iterations and be ready to return the specifically crucial information at that time. The system must follow data quality and visualization methodologies to provide enough information, and the data sources can operate with reliable and updated data.
-
Contextual: The system should be able to understand, identify, and even extract contextual elements from the data, such as meaning, syntax, time, location, task, goal, and many more. The system removes multiple sources of information, such as structured, sensor inputs, unstructured, and semi-structured data.
How Does Cognitive Intelligence Work in Real-Time Anomaly Detection?
Cognitive applications use deep Learning and neural network algorithms to control technological applications such as data mining, pattern recognition, and natural language processing. The system gathers a variety of information and processes it with the previous report it already knows. After the data analysis, it integrates with adaptive page displays to visualize the content for specific audiences in specific situations.
- Data mining
- Pattern recognition
- NLP
The system gathers information, processes it against historical data, and generates adaptive visualizations for specific audiences.
What Are the Five Pillars of a Real-Time Anomaly Detection Platform?
A production anomaly detection system must be built on five operational pillars:
- Data Collection — ingesting continuous streams from logs, sensors, networks, and applications
- Data Aggregation — consolidating multi-source signals into a unified analytical layer
- Visualisation — single integrated dashboard consuming API outputs for cross-system visibility
- Alerts and Notifications — triggered in real time when anomaly thresholds or predictive signals are breached
- Analytics and Exportation — enabling root-cause analysis, capacity planning, and downstream reporting
A platform built on these five pillars must also correlate metrics across nodes, VMs, containers, and applications — supporting both reactive alerting and proactive capacity planning. Systems that deliver all five capabilities consistently achieve broad operational adoption.
How Do Predictive Models Prevent Future Anomalies?
Once correlation is established, the next step is forward-looking: predicting anomalies before they occur.
-
Markov Models analyse feature trend sequences to project future values across
ktimestamps. If feature A is trending toward a failure threshold at timestamp T, the system flags it before component C fails. -
Bayesian Classification estimates the probability that a given set of feature conditions will result in an anomaly — providing ranked likelihood scores for multiple failure hypotheses simultaneously.
Operational impact of prediction vs. reactive detection:
| Scenario | Reactive (detection only) | Predictive |
|---|---|---|
| Failure detected after impact | Yes | Prevented |
| Time to identify root cause | Manual investigation | Automated |
| Time to repair sub-component | After failure | Before failure |
| Business loss | Incurred | Avoided |
The progression from anomaly detection → correlation → prediction → automated optimisation represents the maturity arc of a production-grade anomaly management system.

How does Cognitive Intelligence relate to Analytics?
Cognitive Computing extends the level of analytics to the next level using new technologies. It is used when the vast corpus of textual data is available as a free text document. Therefore, cognitive Computing analyses these documents to support various activities. The cognitive system supports the training of the model using data containing a large set of training examples, like a training of the model using an extensive collection of questions with their corresponding answers.
The goal of cognitive computing is to simulate human thought processes in a computerized model. Source: Cognitive Computing
What is an Anomaly in Data Systems?
Sometimes, unexpected occurrences occur while trying to analyze data, otherwise called anomalies. An "Anomaly" means abnormal or unexpected behaviour or deviation from a regular trend. What are the Anomalies that are encountered in daily life?
-
Server getting down
-
Any unauthorized person entering a network.
-
Data leakage, etc.
- Time-series Databases in Real-Time Analytics
The Need for Anomaly Detection
Earlier, anomalies seldom occur. Suppose the anomaly is not detected and rightful actions are not taken. In that case, the consequences may prove costly in situations like Network intrusion, change in log patterns, data leaks, fraud transactions, Insider trading, and many more. Just imagine the loss that could be incurred if any of the abovementioned lists were to occur.
Why is anomaly detection critical?
Undetected anomalies can lead to severe financial and operational losses.
How Does Real-Time Anomaly Detection Work in Docker and Hadoop Environments?
Docker: The anomaly detection process runs at the same level as the Docker daemon, monitoring container events in real time. When a new container starts, detection begins simultaneously. The system queries the daemon for process IDs inside the container, records syscalls using root privileges, and sends this data to a Redis queue via a message service. The detection algorithm analyses behavioural patterns and notifies administrators when deviations are identified.
Hadoop: Rule-based models have historically been used to alert on anomalies in Hadoop clusters — effective only where domain knowledge is well-defined. When hidden patterns drive anomalies in less-understood business problems, rule-based approaches fail. Pattern recognition techniques — DBSCAN and PCA — are applied instead to detect anomalies without requiring prior domain-specific experience.
How Is Real-Time Anomaly Detection Applied in IoT Systems?
Internet of Things, in simple terms, is the connection between everyday usage devices and the Internet. So, once the device is connected to the internet, access to that device's data is obtained. Essential tools that require anomaly detection techniques are used in industries and business organizations with sensors. Data is received continuously, with every passing second, through these sensors. Notably, in the maintenance of the systems, the sensors have to be monitored to predict the anomaly. These predictions have high economic value because in IoT multiple things are interlinked. While working using immense data, the following things are required?
-
Feature selection — identifying which sensor signals are predictive of anomalies
-
Feature transformation — applying statistical transformations to make patterns detectable
-
Pattern recognition — determining which patterns constitute an anomaly
What features are responsible for the anomaly? What transformations should be made on these features to detect patterns? What patterns signify an anomaly? To explain this with a simple example, let's consider a sensor that gives temperature values for special equipment in an industry. A change in sensor values is used to know if the equipment is stable or about to fail. Tracking is done on the statistical measures of mean and standard deviation of temperatures over time.
If there are changes, that is, a shift in a mean or considerable fluctuations in standard deviation values, there is something wrong with the equipment, and immediate action is required. This notification is sent as an alert. With technological advances, multiple machine learning and statistical techniques are used to identify and predict anomalies accurately. The significant advantage is that once the complete system is automated, one need not always keep track of equipment to know if everything is okay or not.
Log Analytics problem is to use Deep Learning Neural Network as a training classifier for the log data. Click to explore about, Log Analytics and Log Mining with Deep Learning
Anomaly Detection with Deep Learning
Deep Learning can be considered an extension of Artificial Neural Networks(ANN). An artificial neural network consists of input nodes that are passed to a series of hidden layers, and an activation function is used to signify the signal strength that is supposed to be sent to connected nodes. The output is the result of a classification or regression problem. The model uses the result and the error to learn and update the model by changing the parameters involved. Deep Learning is a complicated case involving mathematical concepts like matrix algebra, probability, etc., and intense hardware resources.
The model training with Neural networks and deep Learning happens using an objective function like a stochastic gradient process. The predict the value, calculate the error, and update the model to reduce the error. The implementation of neural networks and deep learning can be done using Keras and TensorFlow, which are open-source and have libraries in Python. Recurrent neural networks store information in the hidden layers, which are updated when new data is fed to the network. These can be used in time series. The applications of RNN are in handwriting recognition, speech recognition, log analysis, anomaly detection, etc. So, 'RNNs are used to find out anomalies in any of the mentioned use cases.
Transitioning from Anomalies to Correlation
Well, if everything goes fine and, let us assume, a reasonably good anomaly detection system is developed, should this be it? NO. It should also be able to determine the factors responsible for the anomaly. The challenge is, what if the data is enormous? Which fields/variables are responsible for an anomaly across so many fields/variables? Finding this is an essential task because it helps take immediate action to reduce the loss if the root cause is found. This analysis to find out the reasons for anomalies is called correlation analysis.
-
Downloading a huge file is the reason for more memory usage in a short time in Log data.
-
Running a machine learning model with massive data results in CPU usage anomalies.
-
A suspicious person trying to enter the network shows sudden changes in Log patterns.
Transitioning from Monitoring to Optimization
Once the correlation is done, the next step is to predict potential anomalies that may occur in the future. So, how do we predict future anomalies? One method is to use Bayesian classification and Markov models. If a component with various features is given and fails any function, it fails the element, which is an anomaly.
Based on the trends of the features Markov model helps in identifying the future values up to some k timestamps, and the Bayesian method is used to predict the probability of anomaly symptoms. The feature "A" is expected to fail after the timestamp "T," which results in the failure of component "C." If feature A is repaired within timestamp T, it will end up making the component "C" run as usual. If it is unable to predict the reason initially and if the component fails, the loss is -
-
Time to identify the reason for the failure.
-
Get the feature(sub-component) repaired.
-
Get the component running again.
Instead, one should be careful enough to predict the failure of any feature by taking several actions before the occurrence. Hence, instead of monitoring every component in the system and resolving the issues, optimization is necessary, followed by the automation of this process. This improves the steps from finding anomalies to preventing anomalies.
What Are the Three Approaches to Finding Anomalies?
Steps to find anomalies are listed below:
1. Supervised Anomaly Detection
In this approach, historical data is used which says data points and class defining if each position is abnormal or not. It is similar to the classification problem. So, the class variable as the anomaly column is taken and applied with the models such as "Random Forest," "XGB," "SVM," or regression algorithms to train the data.
This model is used to determine whether or not the new data point is an anomaly. One should be careful about the ratio of an anomaly to no anomaly in the dataset. It 'shouldn't be too high - for example, more than 1:10 since it becomes a class imbalance problem.
2. Unsupervised Anomaly Detection
Clustering techniques are applied in this, as it is not known before whether a data point is an anomaly. Clustering algorithms detect anomalies.
K-Means clustering
The K- Means Clustering algorithm must be given the number of clusters to be formed as an initial input; based on that value, the algorithm provides the same amount of clusters as an output.
At present, this process will consider all the data points and form clusters. Restrict the distance of the boundary from the centroid from each cluster. The restriction can be 95 percentile or 99 percentile based on the requirement. The points outside this range after the clustering process is done are the anomalies.
DBSCAN
This is also a clustering algorithm that is different from k-means. In DBSCAN, minimum points and maximum distance are chosen as parameters. The algorithm starts with a random point, selects the locations in the neighbourhood, and links them. Each of those will continue the same process.
The patterns are formed with this, and all possible clusters are formed. The leftover points are considered anomalies. In the case of the supervised algorithm, the data should have already been trained, and the model could detect only that kind of anomaly that it had learned before.
Therefore, this algorithm is not feasible for detecting all types of anomalies. So, Unsupervised Algorithms can be used instead of supervised algorithms. This can identify any anomalies from data, i.e. the anomalies that are never seen before.
Use Case of Real-Time Anomaly Detection
The Use Case of Real-Time Anomaly Detection:
1. Log Analysis
Log Data is a time series. So, the data point that is an anomaly depends on time. A particular value might be an anomaly at one timestamp but not another, and vice versa. The server generates information like memory usage, CPU usage, read-write operations, power consumption, etc. Let's consider power consumption usage to detect any abnormal behaviour.
Hypothetical data in a table is described below
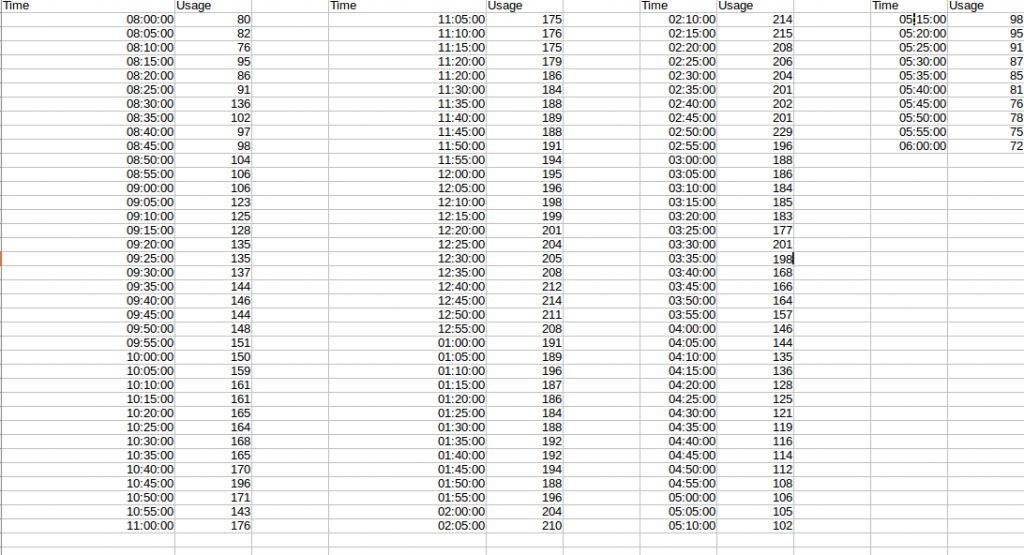 The basic idea is to first get the data to look at the extreme values. Normal distribution may be considered and look for absolute values and conclude them as anomalies. So, based on a mean and standard deviation of the benefits of memory usage, get the points beyond the 90%, 95%, or 99% range based on our requirement and conclude them as anomalies. In that case, all the values above 210 as usage values are considered anomalies. Let us look at the plot for the same data. But is this explanatory enough for time series data?
2. Moving Averages
Moving averages are used assuming that sudden changes wouldn't occur with time. If there is one, then it is an anomaly. To explain the moving average in simple terms, the usage value at the timestamp should be close to the average usage of the past few timestamps. The number of timestamps to take into consideration depends on the data. This technique is called a simple moving average. In this technique, the latest points are as important as the old ones. Another technique is the exponential moving average. In this technique, the latest points are given more importance in the analysis than the old ones. St+1 = α*yt+(1−α)*St , 0 < α ≤ 1 , t > 0.
Neither technique is superior. The method of use depends upon the problem and the data. The point to consider here is that the exponential moving average is sensitive to the latest points but not the simple moving average. Sometimes, one gets misled by the data by ignoring the specific scenarios that seem anomalous but are not. For instance, when there are no employees on an off day, the data is expected to be low. During such scenarios, two problems are analyzed .-
-
False alarms on an off day because there is a mismatch between typical day values and off-day values.
-
The off-day values are used in the analysis to predict the following day's values, giving scope for erred results.
To deal with such incidents, impute the values of the off day with the expected benefits, assuming the day was not off, and continue the analysis. This way, precision and recall could be adjusted.
Importance of Real-Time Anomaly Detection
In specific use cases, anomaly detection has to work in real-time. As soon as the anomaly is detected, several measures can be taken to mitigate the loss. The techniques used in real-time anomaly detection have to evolve with time. Static methods based on existing training data, formed by taking an actual sample, may not serve the purpose of fundamental discoveries. 'That's because data changes are fast and have immense volume, and accordingly, the models have to learn from data for rightful predictions.
Actions to solve the anomaly problem can be delayed, but the detection of an anomaly in real-time cannot be missed. This is because the anomaly data can contain information that can further lead to loss or gain in business. The following are the requirements for building the real-time anomaly detection platform.
-
Collection of data
-
Aggregation of data
-
Visualization
-
Alerts/Notifications
-
Exportation
-
Analytics
A monitoring solution of such calibre must be able to correlate metrics across nodes, VMs, containers, and applications, perform capacity planning, perform proactive monitoring, and generate alerts, notifications, and reports. Any solution with all the above capabilities will surely see widespread adoption.
Summarizing Real-Time Anomaly Detection
Architecture's structure can be based on five critical pillars. They are Collection of data, Aggregation of data, Visualization, Alerts/Notifications, and Exportation. This approach remedies Analytics. Many of the challenges mentioned at the beginning of the article should be present in the ideal next-generation monitoring tool. The challenges faced by visualization are handled by a well-thought-out UI that consumes the API exposed by the solution and provides a single integrated dashboard and a different metrics store for the answer.
It should also offer a unique set of APIs for monitoring hosts, virtual machines, containers, and applications. The five pillars also improve the usability of an ideal solution, which should come packaged with scripts that make it easy to set up on a single workstation and have a rich set of APIs for onboarding, catalogue, labels, availability, metrics, dashboards, and exporter.
- Explore more about Real Time Analytics Architecture
- Discover more about Top Real-Time Analytics Use Cases


