Key takeaway
- Automate data quality across Azure: assert rules in Data Factory, Fabric lake view constraints, Databricks expectations, monitoring and alert routing.
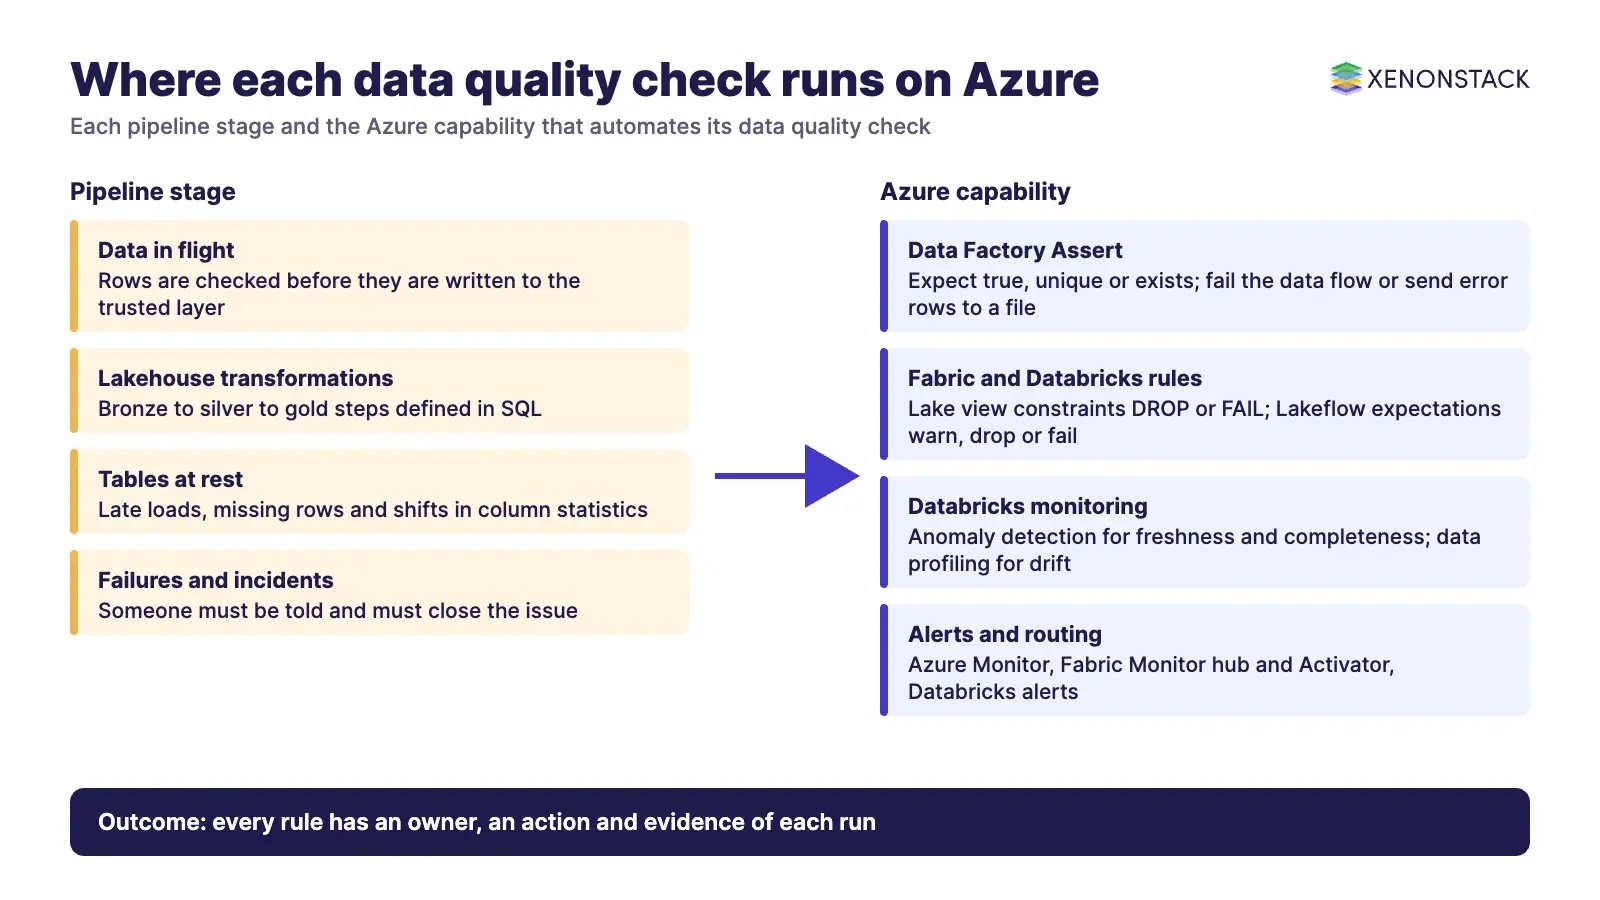
Automated data quality in Azure means each check runs where the data is produced, without someone opening a spreadsheet: mapping data flows in Azure Data Factory assert rules on rows in flight, Microsoft Fabric materialized lake views drop or fail rows that break a constraint, Azure Databricks pipelines apply expectations and Unity Catalog watches table freshness and completeness, and alerts route failures to an owner. The governance question is not which tool to buy, but which rule runs at which stage, who owns the failure and where the evidence is kept.
This guide is about automating those checks across Azure data services. Scoring and publishing quality in the catalog is a separate job, covered in our guide to Microsoft Purview Unified Catalog data quality. For agent-based monitoring on Databricks specifically, see AI-powered data quality monitoring in Databricks.
What does automating data quality across Azure services involve?
Data quality is the accuracy, completeness, consistency, uniqueness and timeliness of the data your decisions depend on (see our overview of data quality management). Automating it means turning each of those expectations into a rule that a pipeline evaluates on every run, with a defined action when the rule fails: keep the row and record the failure, drop or quarantine the row, or stop the load.
On Azure that work is split across services. Checks on data in motion belong in the pipeline engine (Data Factory, Fabric or Databricks). Checks on data at rest, such as whether a table is late or has fewer rows than usual, belong in a monitoring layer. Quality scores that business users read belong in the catalog. Alerts belong in Azure Monitor, the Fabric Monitor hub or Databricks alerts. A workflow is automated when these four layers are connected and every failure lands with a named owner.
| Layer | Question it answers | Azure capability |
| In-pipeline rules | Does each row meet the rule before it is written? | Assert transformation (Data Factory), constraints (Fabric materialized lake views), expectations (Databricks Lakeflow pipelines) |
| Table monitoring | Is the table fresh, complete and statistically normal? | Databricks anomaly detection and data profiling; Fabric column-level checks |
| Catalog scoring | Can a business user trust this data product? | Microsoft Purview Unified Catalog data quality |
| Alerting and routing | Who is told, and what happens next? | Azure Monitor alerts, Fabric Monitor hub alerts and Activator, Databricks alerts |
Which Azure service should run each data quality check?
Run each check in the engine that already transforms the data, so the rule and the transformation share one deployment, one owner and one run history. The table summarises the main options as documented on Microsoft Learn in November 2026.
| Capability | What it does | When it fits | Current status |
| Azure Data Factory: Assert transformation in mapping data flows | Rules of type Expect true, Expect unique and Expect exists; can fail the data flow immediately or tag error rows and send them to a file through the sink Errors tab | Existing Data Factory or Synapse pipelines that already use mapping data flows | Available in Data Factory and Synapse pipelines; not supported in Dataflow Gen2 |
| Microsoft Fabric: materialized lake view constraints | CONSTRAINT ... CHECK with ON MISMATCH DROP or FAIL (FAIL is the default); dropped-row counts appear in lineage |
Medallion (bronze, silver, gold) transformations written in Spark SQL in a Fabric lakehouse | Documented for SQL authoring; PySpark authoring is in preview |
| Microsoft Fabric: column-level checks on materialized lake views | Deequ-based suites (completeness, uniqueness, statistical shape) with FAIL or WARN; FAIL blocks dependent views | Rules about a whole column, such as a business key with no duplicates | Documented; can run after every scheduled refresh |
| Azure Databricks: expectations in Lakeflow pipelines | SQL Boolean constraints with warn (default), drop or fail; metrics written to the pipeline event log | Batch and streaming pipelines on Databricks, usually at the bronze to silver boundary | Lakeflow Spark Declarative Pipelines, formerly Delta Live Tables; requires the Premium plan |
| Azure Databricks: data quality monitoring | Anomaly detection for freshness and completeness across a schema; data profiling for table statistics and drift | Watching many tables without writing a rule for each | Data profiling was formerly Lakehouse Monitoring; percent null and completeness slicing are in Beta |
| Microsoft Purview Unified Catalog data quality | Rules, scans and scores that roll up to data products and governance domains | Publishing a trusted score to business users across sources | See the Purview data quality guide |
If your estate already runs on Data Factory, keep rules close to the existing data flows. For new data integration work, Microsoft describes Data Factory in Microsoft Fabric as the next generation of Azure Data Factory and offers an upgrade path, so check before building new rules in mapping data flows that Dataflow Gen2 does not yet support. See also Azure Data Factory vs Apache Airflow.
What has changed in Azure data quality tooling?
Several product names and recommendations have moved. Use the current names in runbooks so teams search the right documentation.
| Earlier name or approach | Current position |
| Delta Live Tables (DLT) expectations | Lakeflow Spark Declarative Pipelines (Lakeflow pipelines). Existing DLT code still runs; import dlt can be replaced with from pyspark import pipelines as dp |
| Databricks Lakehouse Monitoring | Data profiling, part of data quality monitoring alongside anomaly detection |
| Azure Purview | Microsoft Purview, with data quality in Unified Catalog |
| Azure Data Factory as the default for new integration work | Microsoft points new users to Data Factory in Microsoft Fabric and documents an upgrade path from Azure Data Factory |
How do you build an automated data quality workflow on Azure?
The sequence below works whichever engine you choose.
1. Agree the rule, the owner and the action
Write each rule as a Boolean condition with a name, an owner and a chosen action. Databricks guidance for production pipelines is a useful test for any engine: choose fail for conditions that should stop processing, such as a broken primary key; drop for records you can safely discard, with a quarantine table that captures what was dropped; and warn only where someone actively watches the trend. Start from the defects you already see; our list of common data quality issues is a practical checklist.
2. Enforce the rule where data enters the trusted layer
Gates usually sit at the bronze to silver boundary, so everything downstream can be trusted without re-checking. In Data Factory, add an Assert transformation to the mapping data flow and decide whether a failed assertion fails the data flow or is tagged and handled downstream with isError() and hasError(). In Fabric, declare the constraint in the CREATE MATERIALIZED LAKE VIEW statement. In Databricks, declare an expectation on the streaming table or materialized view.
3. Quarantine rather than silently drop
Dropping rows keeps the target clean but hides the evidence. Data Factory can write assertion failures to a file in Azure from the sink, and database sinks can output rejected rows with the error code and message. Databricks documents a quarantine pattern with two flows, one that drops invalid rows from the main table and one that writes only invalid rows to a quarantine table. Fabric shows the count of dropped records in the lineage view.
4. Gate downstream work explicitly
A failed rule does not always stop what comes next. In a triggered Databricks pipeline, a failed expectation rolls back only that flow, and a validation table does not make downstream tables wait. To stop downstream processing, Databricks recommends splitting validation and downstream work into separate pipelines coordinated by a job. In Fabric, a column-level check set to FAIL blocks the materialized lake views that depend on it, while independent branches continue.
5. Monitor tables, not only rows
Row rules do not catch a load that never arrived. Databricks anomaly detection learns each table's commit history and row counts, marks a table stale when a commit is unusually late, marks it incomplete when rows in the last 24 hours fall below the expected range, and uses Unity Catalog lineage to point to a likely root cause such as a job failure or an unhealthy upstream table. In Fabric, column-level suites compute metrics such as completeness and mean, and can run after every scheduled refresh.
6. Score, publish and trace
Publish quality where consumers look for it. Microsoft Purview Unified Catalog turns rules into scores for data products and domains, which is the subject of our Purview data quality guide. Lineage connects a failed rule to the reports and models it affects; see open standards for end-to-end data lineage.
How should data quality alerts reach the right owner?
Each service has its own alerting path, and a governed workflow connects them to one incident process.
- Azure Data Factory: Azure Monitor alert rules on metrics such as failed pipeline runs greater than zero. Data Factory keeps pipeline run data for only 45 days, so route diagnostic logs to a Log Analytics workspace for longer retention and custom queries; logs can take up to 15 minutes to appear there.
- Microsoft Fabric: free email notifications for failed scheduled jobs, and Activator-based alert rules in the Monitor hub (preview) for more job events and automated actions. Activator can also start a pipeline, notebook or other Fabric item when a rule condition is met.
- Azure Databricks: anomaly detection alerts on unhealthy tables, pipeline failure notifications by email, webhook or event hook, and expectation metrics in the pipeline event log. Metrics are recorded for warn and drop, not for fail, because a fail stops the update.
The short ElixirClaw film below applies the same idea to business KPIs: anomaly detection handled by AI agents rather than by someone noticing a dashboard.
KPI anomaly detection with AI agents (ElixirClaw).
What governance, security and cost controls apply?
Treat data quality rules as governed policy, not as pipeline decoration. Each rule should have a version in source control, an owner, a documented action and evidence of every run.
- Permissions: enabling Databricks anomaly detection on a schema needs the
MANAGEprivilege on the schema or its catalog; viewing quality details needsSELECTon the table. Creating Fabric Activator-based job alerts needs workspace Owner or Contributor permission. - Evidence: Databricks records expectation metrics in the pipeline event log and anomaly results in the
system.data_quality_monitoring.table_resultssystem table. Fabric writes materialized lake view run metrics to_mlv_systemtables. Data Factory evidence lives in Log Analytics once diagnostic settings are configured. - Cost: anomaly detection requires serverless compute, though Databricks does not bill for the storage of scan results. Fabric Activator-based alerts consume Activator capacity and need workspace monitoring, which can add cost. Purview data quality is billed in data governance processing units, as explained in the Purview guide.
- Human approval: in our own data platform work, the pattern that holds up is automated detection with a named person approving any fix that changes business data. Agents can propose a correction, but the approval and its reason should be recorded.
When AI agents start acting on quality signals, for example rerunning a load or correcting a reference value, the decision needs the same controls as a human change. ElixirData Context OS keeps governed context, versioned policy and decision traces in one decision layer above AI agents, and AgentGRC keeps autonomous agent actions inside policy, with the audit trail risk teams need.
In what order should an enterprise adopt automated data quality?
| Phase | What to do | Exit criterion |
| 1. Baseline | Pick one business-critical data product; list its rules, owners and current defects | Every rule has an owner and an action (warn, drop or fail) |
| 2. Enforce | Add rules in the engine that loads the data; quarantine failed rows | Rule pass rates visible per run |
| 3. Monitor | Enable table-level freshness and completeness monitoring on the schema | Late or short loads raise an alert before users notice |
| 4. Route | Connect alerts to one incident process with a named owner and response time | Every alert has an owner and a closed outcome |
| 5. Publish | Publish scores in the catalog and link them to lineage | Consumers can see quality before they use the data |
| 6. Scale | Reuse rule sets across datasets; review thresholds quarterly | New pipelines ship with rules by default |
When remediation steps span several systems, an agentic workflow can carry the hand-offs. ElixirClaw is an agentic OS platform to build, orchestrate and govern AI agents and automation workflows while keeping humans in control.
What are the trade-offs, and when should you not automate a check?
- Fail stops the line: use it for hard contracts only. In Databricks a fail requires you to fix the pipeline before re-running; in Fabric a row-level constraint defaults to FAIL unless you choose DROP.
- Drop hides evidence: without a quarantine table, dropped rows are counted but not kept for investigation.
- Expectations can change refresh behaviour: a Databricks materialized view whose definition includes expectations is fully refreshed on each update and does not support incremental refresh.
- Feature gaps on migration: the Assert transformation is not supported in Dataflow Gen2, so plan rule placement before moving mapping data flows to Fabric.
- When not to automate: one-off analyses, data that no decision depends on, and rules that nobody owns. Automating an unowned rule produces alerts that nobody closes.
To map one data quality decision your pipelines and agents should make, and the context and policy it depends on, book a Context Workshop. See what happens in the workshop.
Frequently asked questions
Can Azure Data Factory run data quality checks automatically?
Yes. The Assert transformation in mapping data flows supports Expect true, Expect unique and Expect exists rules, can fail the data flow when a rule fails, and can send failed rows to a file in Azure. It is available in Data Factory and Synapse pipelines but not in Dataflow Gen2.
How does Microsoft Fabric enforce data quality?
Materialized lake views accept constraints with ON MISMATCH DROP or FAIL, where FAIL is the default. Column-level checks based on Deequ can validate completeness, uniqueness and statistical shape with FAIL or WARN, and a FAIL blocks dependent views.
What replaced Delta Live Tables expectations in Databricks?
Delta Live Tables is now Lakeflow Spark Declarative Pipelines. Expectations still work with warn, drop or fail actions, existing DLT code runs without migration, and metrics for warn and drop are written to the pipeline event log.
How is this different from Purview data quality?
Pipeline checks in Data Factory, Fabric and Databricks stop or quarantine bad data as it is processed. Microsoft Purview Unified Catalog data quality scores data products and domains for business users. Most enterprises need both, connected by alerts and lineage.
How do you get alerted when a data quality check fails?
Use Azure Monitor alert rules for Data Factory, Monitor hub notifications and Activator-based alert rules for Fabric, and anomaly detection alerts and pipeline notifications for Databricks. Route all of them to one incident process with a named owner.
Follow XenonStack on LinkedIn: XenonStack on LinkedIn for new guides on agentic AI, data and platform engineering.
Explore the XenonStack platform family: ElixirData · ElixirClaw · ElixirHub · NexaStack · MetaSecure · Neural AI · AgentGRC · AgentSRE · AgentAnalyst · AgentInstruct · AgentRAI · AgentScrum · AgentSearch · AgentForce · AI Aviator · SAIF Aviator · CohortIQ · XenonStack AI · XenonStack UAE