Key takeaway
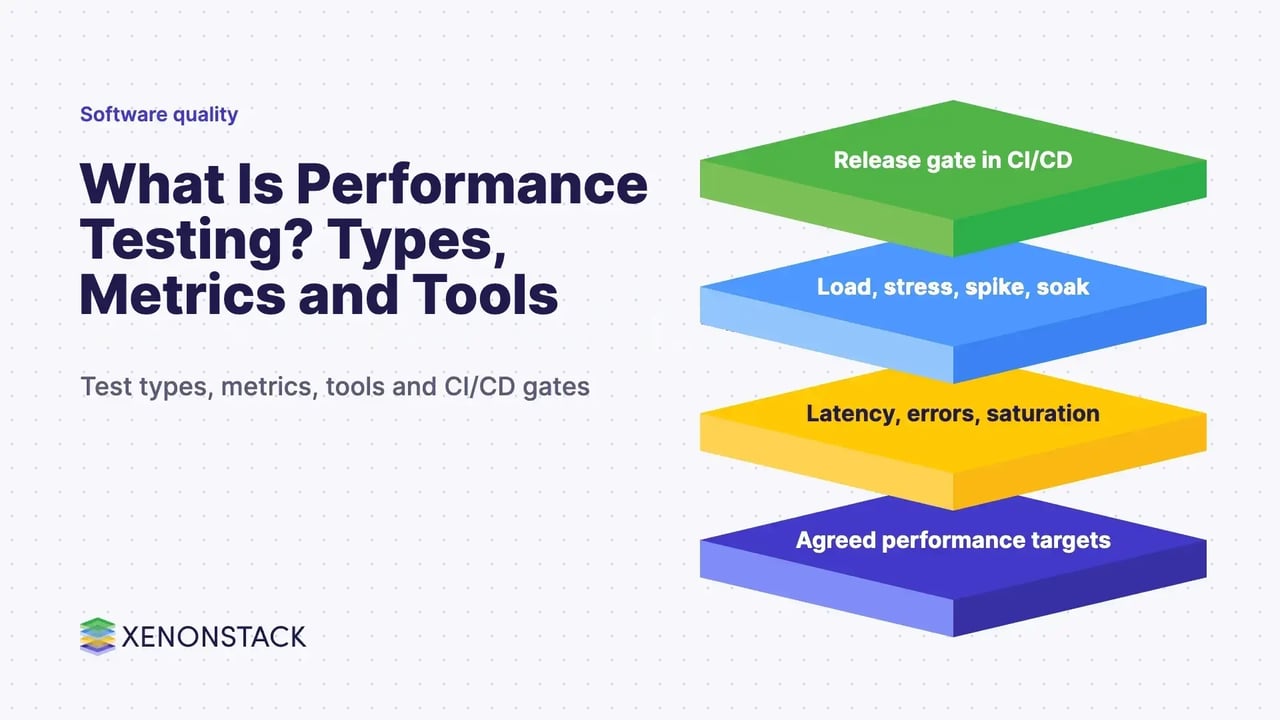
- Performance testing explained: load, stress, spike and soak tests, the metrics that matter, a six-step process, JMeter and Gatling, and CI/CD gates.
Performance testing is a type of non-functional testing that measures how an application behaves under a defined load: how fast it responds, how many requests it handles, how much CPU and memory it uses, and whether it stays stable. It answers a question functional tests cannot: does the system still meet its targets when many real users arrive at once?
For enterprise teams the practical point is to test against agreed targets, in a production-like environment, early enough to change the design. This guide covers the test types, the metrics worth tracking, a six-step process, the tools, and how to gate releases in CI/CD. It sits beside our guides to unit testing and functional and non-functional testing.
What are the types of performance testing?
Grafana k6 documents six test types, each with a different purpose. The definitions below follow its test-types guide, which also advises starting with a smoke test and moving to average-load tests and more complex patterns.
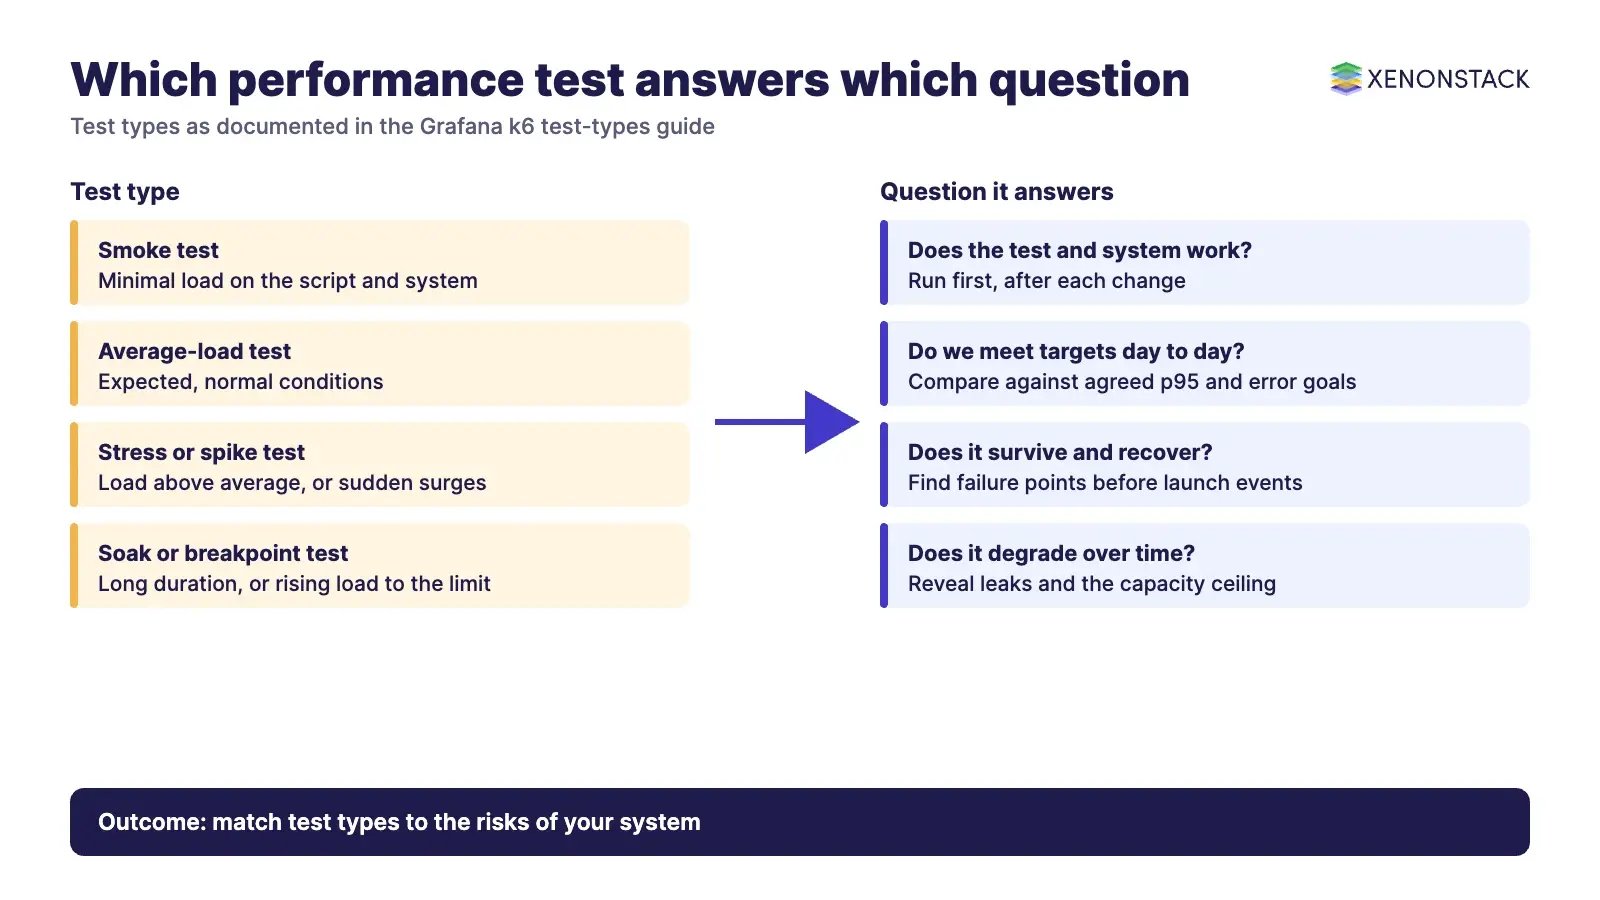
| Test type | What it checks | When it fits |
|---|---|---|
| Smoke test | That the script works and the system performs adequately under minimal load | After code or configuration changes, before larger tests |
| Average-load test | Performance under expected, normal conditions | To confirm typical everyday use stays within targets |
| Stress test | Behaviour at the limits, when load exceeds the expected average | When above-average load is possible |
| Soak test | Reliability and performance over extended periods | After changes, to expose slow leaks and gradual degradation |
| Spike test | Survival under sudden, short, massive increases in activity | Before seasonal events or known traffic peaks |
| Breakpoint test | Capacity limits, by gradually increasing load | To find the upper limit of the system |
Two terms in older guides need care. Load testing is usually the average-load or peak-load case, while stress testing deliberately goes beyond expected demand. Volume testing, which checks behaviour with large data sets, is a separate concern from concurrent users. k6 notes that no single test type removes all risk, so emphasise the types that match your system's risk profile. For a deeper look at the load case, see load testing tools and best practices and continuous load testing.
Which performance testing metrics matter?
Pick a small set of metrics, define each precisely, and set a target before the test. The Google SRE book recommends four signals for any user-facing system: latency, traffic, errors and saturation. They map directly to test metrics.
| Metric | What it tells you | How to report it |
|---|---|---|
| Response time (latency) | Time taken to serve a request | Percentiles such as p95 and p99, not only the average |
| Throughput | Units of work processed in a period, such as requests per second | Per transaction type, over the steady-state window |
| Error rate | Share of failed requests | Separate failed from successful latency |
| Resource use (saturation) | CPU, memory, disk and network headroom | Alongside load, to find the constrained resource |
| Concurrency | Simultaneous users or virtual users | Tied to a realistic user model |
Averages hide the tail. The SRE book gives an example: at 1,000 requests per second with a 100 ms average, 1 per cent of requests could still take about 5 seconds, which is why it recommends latency buckets or histograms. It also advises tracking error latency separately, because a slow error is worse than a fast one. For browser experience, web.dev currently lists three Core Web Vitals with "good" thresholds at the 75th percentile of page loads: Largest Contentful Paint at 2.5 seconds or less, Interaction to Next Paint at 200 milliseconds or less, and Cumulative Layout Shift at 0.1 or less. web.dev also states that lab measurement is not a substitute for field measurement. Pair this guide with performance monitoring in production.
What are the steps in performance testing?
A repeatable process matters more than any single tool. Six steps cover most programmes.
- Identify the test environment and tools. Record hardware, software, data volumes and configuration, and keep the environment as close to production as you can.
- Set performance acceptance criteria. Agree response time, throughput and error-rate goals with the business owners, for example a p95 target for a named transaction.
- Plan and design the tests. Model real user journeys and data, then choose the test types from the table above.
- Configure the environment. Prepare test data, monitoring and load generators.
- Run the tests and monitor. Capture application and infrastructure metrics together so each result can be explained.
- Analyse, tune and retest. Fix the largest bottleneck, rerun, and compare against the baseline.
How do you choose a performance testing tool?
Choose by protocol coverage, scripting model, CI/CD fit and team skills. Two long-established open-source options illustrate the range. According to its site, Apache JMeter is a 100 per cent pure Java application designed to load test functional behaviour and measure performance, and it lists HTTP and HTTPS, SOAP and REST, FTP, JDBC databases, LDAP, JMS, mail protocols and TCP. According to its docs, Gatling lets teams write load tests as code, with Java and JavaScript or TypeScript SDKs, and lists HTTP, WebSocket, SSE, GraphQL, JMS, MQTT and gRPC.
| Need | What to look for | Confirm on the official page |
|---|---|---|
| Broad protocol coverage, GUI authoring | JMeter lists many protocols in one tool | Current release and Java requirement |
| Tests as code in the repository | Gatling or k6 scripting | Current SDK languages and edition features |
| Pass or fail in a pipeline | Thresholds that return a failing exit code | Tool-specific syntax |
| Browser experience | Lab tools plus field data | Current Core Web Vitals guidance |
For browser-side tools see web performance testing tools. Pricing, editions and cloud offerings change, so confirm them on each vendor page before you decide.
How do you add performance tests to CI/CD?
Run a small smoke test on every change, a fuller average-load test on a schedule or before release, and soak or stress tests before major launches. Make the targets executable. In k6, thresholds are pass or fail criteria: if one evaluates to false, k6 marks the test as failed and exits with a non-zero code. Its documented example sets http_req_failed to rate<0.01 and http_req_duration to p(95)<200. That turns a performance budget into a release gate. This is the practical meaning of shift-left: see shift-left testing, and keep functional safety nets in place with regression testing and API testing, since API-level load tests are often the cheapest to run.
What about AI agents and performance testing?
Agentic systems add variable latency, token and tool-call costs, and non-deterministic paths, so the same discipline applies with extra metrics: end-to-end task time, tool-call error rate and cost per task. Treat these as targets in the same way as response time. ElixirData Context OS keeps governed context, versioned policy and decision traces in one decision layer above AI agents, which gives you the traces to explain a slow or failed run. According to its site, AgentEvaluation scores and benchmarks enterprise AI agents before and after they go live. For design patterns, read agentic workflows.
When is performance testing not enough?
- A synthetic test cannot reproduce every real device, network and behaviour, so add field monitoring.
- A test environment smaller than production gives results that do not scale linearly; state the assumption.
- Passing average-load tests says little about spikes or long-running leaks, so include spike and soak tests where the risk exists.
- Performance is one quality attribute; it does not replace functional and security testing.
To map one release decision your agents should make, and the context and policy it depends on, book a Context Workshop. See what happens in the workshop.
Frequently asked questions
What is performance testing in simple terms?
It is non-functional testing that measures speed, throughput, resource use and stability under a defined load, to find bottlenecks before users do.
What is the difference between load, stress and spike testing?
Per the k6 guide, an average-load test checks normal conditions, a stress test checks behaviour when load exceeds the average, and a spike test checks survival of sudden, short and massive increases in activity.
Which metrics should I track?
Start with latency percentiles, throughput, error rate and resource saturation, the same signals the Google SRE book recommends for user-facing systems.
Which tool should I use, JMeter or Gatling?
JMeter lists broad protocol support in a single Java tool. Gatling writes tests as code with Java and JavaScript or TypeScript SDKs. Choose by protocols, team skills and CI/CD fit, and confirm current features on each site.
How do I fail a build on poor performance?
Use thresholds. In k6, a failed threshold makes the run exit with a non-zero code, which a pipeline treats as a failed step.
Should performance tests run on every commit?
Run a light smoke test on every change and reserve larger load, stress and soak tests for scheduled runs and pre-release gates.
Ready to put AI agents to work? See an ElixirClaw demo: the agentic OS to build, orchestrate and govern AI agents across your enterprise systems.
Explore the XenonStack platform family: ElixirData · ElixirClaw · ElixirHub · NexaStack · MetaSecure · Neural AI · AgentGRC · AgentSRE · AgentAnalyst · AgentInstruct · AgentRAI · AgentScrum · AgentSearch · AgentForce · AI Aviator · SAIF Aviator · CohortIQ · XenonStack AI · XenonStack UAE