Key takeaway
- Continuous load testing explained for CTOs: tools compared (JMeter, k6, Gatling), CI/CD pipeline gates, metrics, Slack case and adoption steps.
What is continuous load testing and how does it differ from a one-off load test?
Continuous load testing runs automated load tests on every meaningful change and on a schedule, so teams learn that a release has slowed the system before customers do. Unlike a single pre-launch test, it treats performance as a regression risk to be checked in the delivery pipeline. This guide gives CTOs, CIOs and platform leads the tool choices, the pipeline gates and the adoption order. For a wider tool comparison, see our overview of load testing tools and best practices.
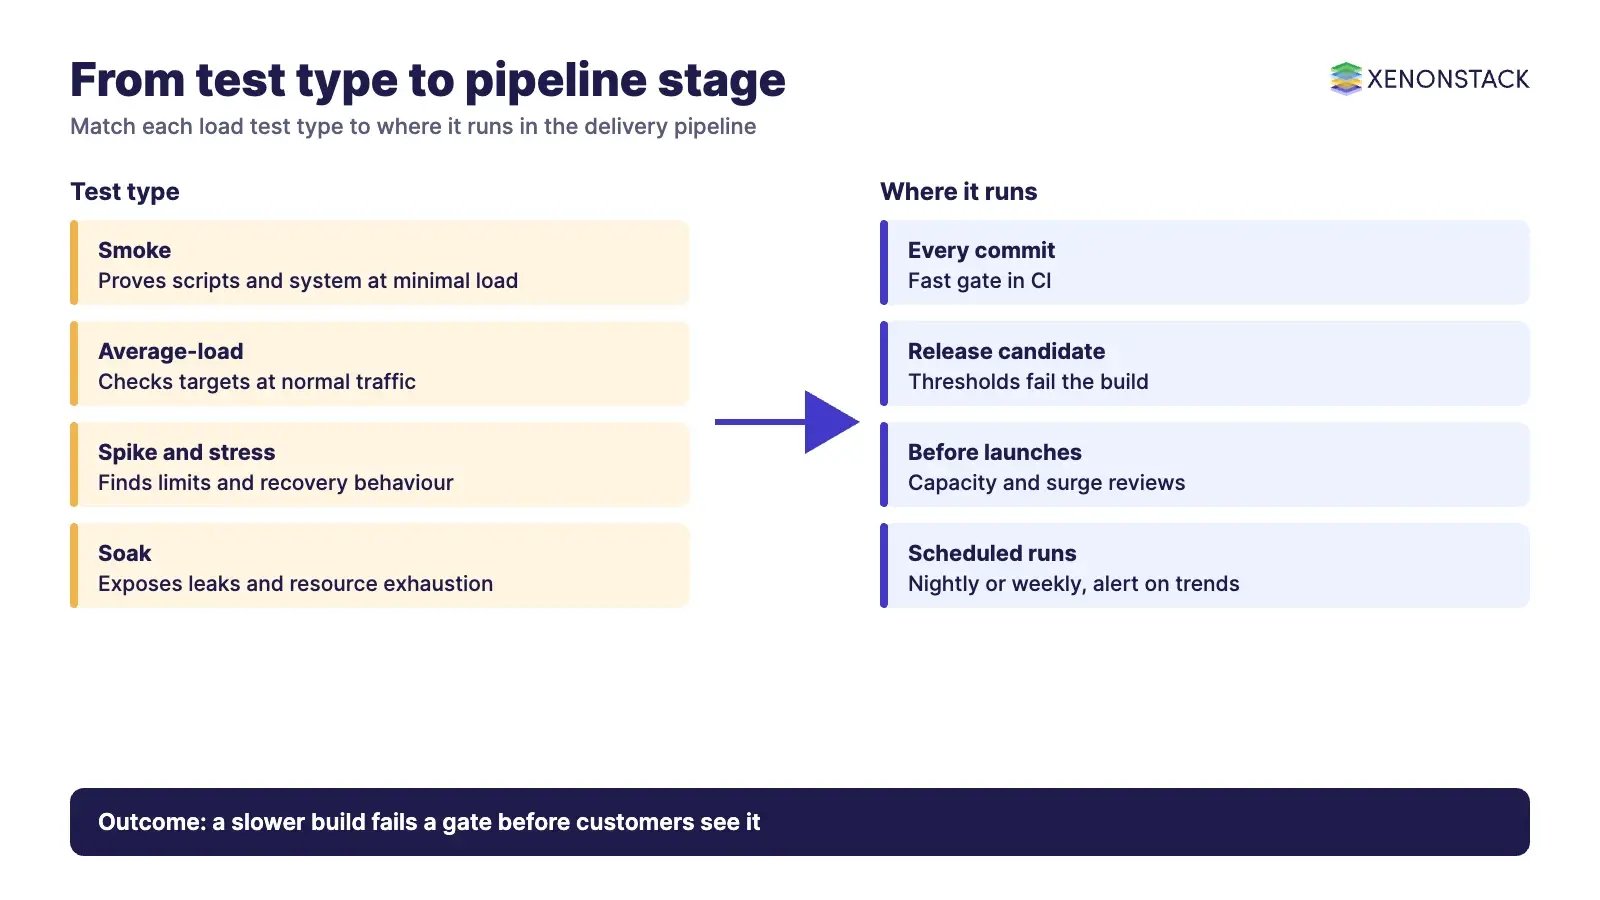
The practical test is simple: if a slower build can reach production without a failed gate, you are not yet testing continuously. The approach sits inside continuous testing in DevOps and depends on the same pipeline discipline described in the role of continuous testing in continuous delivery.
Grafana k6, one of the current open-source tools, names six test types in its documentation: smoke, average-load, stress, soak, spike and breakpoint tests. The table shows where each fits in a continuous programme.
| Test type | Question it answers | Where it fits |
|---|---|---|
| Smoke | Does the script and the system work at minimal load? | Every commit, as a fast gate |
| Average-load | Does the system meet targets at normal traffic? | Every release candidate |
| Stress and breakpoint | Where does the system degrade or fail? | Before major launches and capacity reviews |
| Spike | Can it absorb a sudden surge and recover? | Before campaigns, sales or events |
| Soak | Does a steady load expose memory leaks or resource exhaustion over time? | Scheduled runs, for example nightly or weekly |
Source for the test types: Grafana k6 documentation, read 11 November 2026.
Video: Continuous Load Testing Tools and Features, from XenonStack.
Why does continuous load testing matter to enterprise leaders?
Slow or unavailable platforms cost customers, revenue and trust, and they slow internal teams that depend on the same services. The risk grows when releases are frequent, because each change can shift response time or resource use slightly, and small shifts compound. A scheduled check turns that drift into a visible trend rather than an incident.
Our own delivery experience points the same way. Engineering checklists shared in our internal discussions list load testing alongside rate limiting, abuse protection, monitoring dashboards and rollback mechanisms as part of production readiness, not as a separate late phase.
Which continuous load testing tools fit which team?
Choose by who writes the tests, where load is generated and which pipeline runs them. The table reflects each vendor's own site as read on 11 November 2026.
| Tool | Fits when | Current status |
|---|---|---|
| Apache JMeter | You need broad protocol coverage (HTTP, JDBC, JMS, LDAP, FTP and more) in an open-source tool | Run load tests in non-GUI mode; the GUI is for building scripts. Needs Java 8 or higher; distributed runs use remote server nodes |
| Grafana k6 | Developers want tests as JavaScript or TypeScript code with pass or fail thresholds in CI | Open source; documentation shows v2.3.x as current |
| Gatling | Teams want tests as code, run from CI/CD | Tests in Java, JavaScript or TypeScript per its site; Community Edition for local use, Enterprise adds AI analysis, SLOs and managed load generation |
| Artillery | You test HTTP, GraphQL or Socket.IO services, or reuse Playwright tests for browser load | Platform covers load testing, Playwright end-to-end testing and synthetic monitoring; runs on its cloud or your own AWS or Azure account |
| BlazeMeter | You want a managed platform that runs open-source scripts and adds performance gates to CI | Now branded Perforce BlazeMeter; works with more than 20 open-source frameworks, including JMeter and Gatling |
| LoadRunner (OpenText) | Enterprise estates with packaged applications such as SAP and Oracle | LoadRunner Professional is now called OpenText Professional Performance Engineering; the page lists 180+ protocols and technologies |
| NeoLoad (Tricentis) | Enterprise teams testing SAP, Salesforce, ServiceNow or messaging systems | A Tricentis product; lists Jenkins, Azure DevOps, GitHub, GitLab, CircleCI and TeamCity integrations |
What has changed in load testing tools?
- LoadRunner is no longer sold under the Micro Focus name; its Professional edition is now OpenText Professional Performance Engineering.
- BlazeMeter is now a Perforce product, and describes support for more than 20 open-source frameworks rather than being only a JMeter wrapper.
- Artillery now positions itself as one platform for load testing, Playwright end-to-end tests and synthetic monitoring.
- Gatling lists AI analysis and SLOs among its Enterprise features, and NeoLoad lists MCP servers among supported technologies.
- k6 is maintained by Grafana, and its documentation covers six test types and CI/CD use.
How did Slack run load tests continuously?
Slack's engineering team described its approach in a post published in April 2022. It kept simulated clients booted against a large test organisation so that engineers did not set up clients for each test. Its main tool, Koi Pond, runs simplified clients in Kubernetes pods of up to 5,000 each, and the rollout ramped from 5,000 to 500,000 clients with a week of monitoring at each stage.
Two design choices matter to any enterprise. First, automatic shutdown reads Prometheus metrics and stops a test that breaches a threshold, for example web API success below 95% for five minutes, with an emergency stop for all tests. Second, the continuous clients ran against an organisation about four times the size of Slack's largest customer, which gave a baseline for judging wide-reaching changes. Slack reported that setting up a GovSlack test took minutes rather than the day an ad hoc test needed, and that it reproduced a customer-facing incident within about an hour.
Which metrics should gate a pipeline?
Track a small set and give each an explicit pass or fail limit agreed with the service owner:
- Response time: judge percentiles, not only averages, because slow tails hurt users.
- Throughput: requests handled per second at the agreed load.
- Error rate: the share of requests that fail.
- Resource use: CPU, memory, disk and network, which expose leaks and exhaustion in soak runs.
- Scalability: how the system behaves as load rises, including recovery after a spike.
In k6, a threshold is an expression such as p(95) < 200 that is checked when the test ends. If every threshold holds, k6 exits with code 0, and if any fails it exits with a non-zero code, which lets a CI job fail the build. The same pattern applies to other tools by reading their summary results in the pipeline. Feed results into your monitoring and application performance management stack so that a test run can be compared with production behaviour.
What is a sensible adoption sequence?
- Pick two or three business-critical journeys and API paths, and write down the target response time and error rate for each.
- Add a short smoke test to the pipeline so scripts are proven on every commit.
- Add an average-load test to release candidates in a production-like environment, with thresholds that fail the build.
- Schedule soak and spike runs outside the commit path, and alert on trends rather than single results.
- Add automatic stop rules and an owner for every threshold, then review the thresholds each quarter.
- Extend to production-like data volumes and, where the organisation is ready, controlled tests in production with a kill switch.
Run load tests from the tool's command-line mode rather than a desktop interface; the JMeter guide states that load tests must not run in GUI mode. Related automation practice is covered in our guide to testing agentic process automation.
How do you load test AI agents and agentic systems?
Agentic systems add load that classic web tests miss: many model and tool calls per user task, retries, and shared downstream systems. Test the whole task path, not just one endpoint, and set limits on retries and concurrent actions before you scale up. Platforms such as ElixirClaw describe an agentic OS to build, orchestrate and govern AI agents and automation workflows while keeping humans in control, which gives load tests a clear place to check limits and audit logs. For operations teams, AgentSRE describes agents that spot problems, work out their causes and fix them, which is the stage after a failed threshold. Where a test outcome decides whether a release proceeds, ElixirData Context OS keeps governed context, versioned policy and decision traces in one decision layer above AI agents.
What are the trade-offs, and when should you not run continuous load tests?
- Test environments that do not resemble production give false comfort, and a faithful copy costs money. Decide the fidelity you can afford.
- Third-party services and payment gateways usually forbid load, so stub them and say so in the report.
- Very small or low-traffic internal tools rarely justify nightly soak runs; a smoke test in the pipeline is enough.
- Thresholds nobody owns become noise. If no one will act on a failed gate, fix ownership first.
- Generated load can reach shared systems. Use automatic stop rules, as Slack did, before widening scope.
To map one release-gating decision your teams or agents make, and the context and policy it depends on, book a Context Workshop. See what happens in the workshop.
Frequently asked questions
What is continuous load testing?
It is automated load testing run on every meaningful change and on a schedule, so performance regressions are caught in the delivery pipeline instead of in production.
How is it different from a traditional load test?
A traditional test is a short, planned exercise before a launch. Continuous load testing repeats smaller tests in the pipeline and runs longer scheduled tests such as soak runs, with pass or fail thresholds.
Which tool should we choose?
Choose by team skills and estate. JMeter suits broad protocol coverage, k6 and Gatling suit tests written as code, and LoadRunner and NeoLoad list support for packaged enterprise applications such as SAP. Confirm current features on each vendor's site.
How do we stop a load test from harming shared systems?
Set automatic stop rules on metrics. Slack's system stops a test if web API success stays below 95% for five minutes, and it has an emergency stop for all running tests.
Should load tests run in GUI mode?
No. The Apache JMeter guide says GUI mode is for building scripts and that load tests must run in command-line mode.
Follow XenonStack on LinkedIn: XenonStack on LinkedIn for new guides on agentic AI, data and platform engineering.
Explore the XenonStack platform family: ElixirData · ElixirClaw · ElixirHub · NexaStack · MetaSecure · Neural AI · AgentGRC · AgentSRE · AgentAnalyst · AgentInstruct · AgentRAI · AgentScrum · AgentSearch · AgentForce · AI Aviator · SAIF Aviator · CohortIQ · XenonStack AI · XenonStack UAE