Key takeaway
- Performance tuning explained: find the bottleneck, profile CPU and memory, benchmark in Go, compare runs with benchstat, and see how AI agents help.
Performance tuning is the practice of measuring a system, finding the part that limits its speed or resource use, changing that part, and measuring again to prove the change helped. It replaces guesswork about which code is slow with evidence from profiles and benchmarks.
This guide is for engineers and technical leads who own application speed, cost or reliability. It uses Go as the worked example because its toolchain ships with profiling and benchmarking, and it covers the method, the tools, how to compare results, and how AI agents change the routine. It sits beside benchmarking, performance testing, performance profiling and performance tracing.
What is performance tuning and what is a bottleneck?
A bottleneck is the single stage of a system that limits overall throughput or response time. Tuning anything else yields little, so the first job is to locate it. You cannot tell by reading two candidate algorithms which one will run faster on real data. You run both, record the results, and compare them.
A change is only an improvement when the same measurement, taken the same way before and after, shows it. That is why every result must be stored in a file: without a saved baseline there is nothing to compare against.
How does the performance tuning loop work?
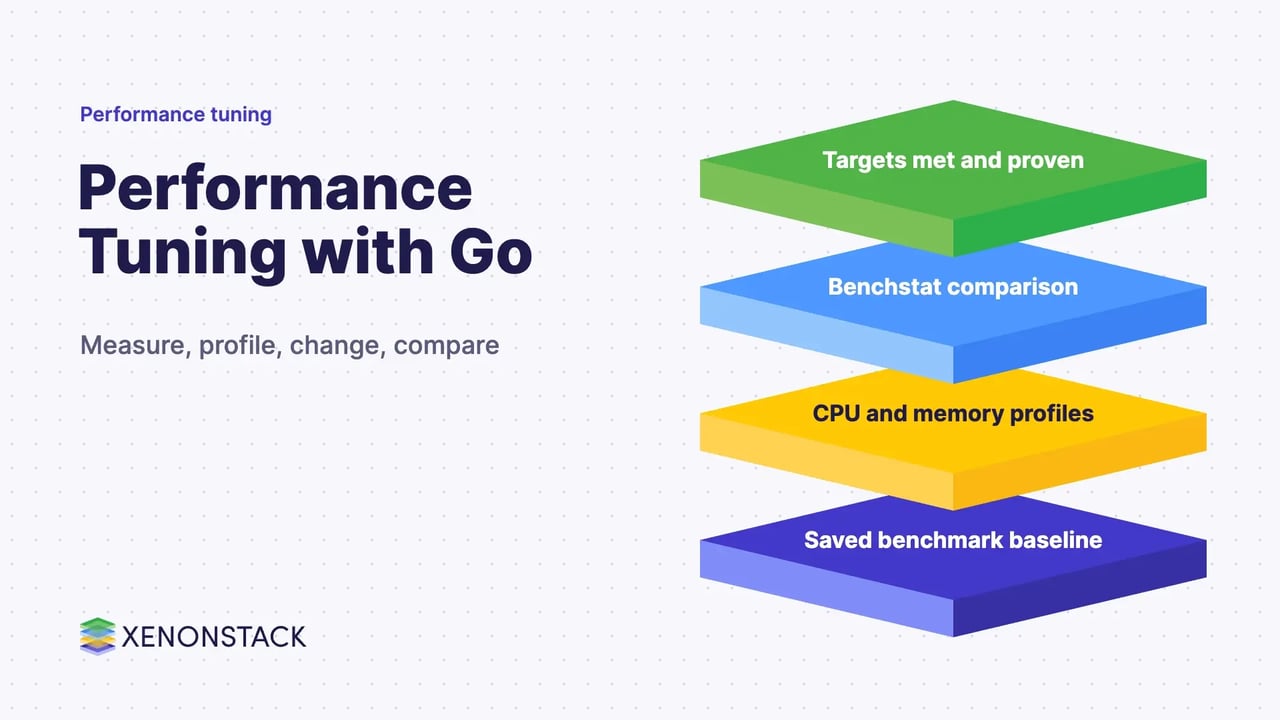
The loop is the same in any language. Measure, find the hot spot, change one thing, measure again. The Go team's article Profiling Go Programs shows it in practice: its CPU profiler samples the running program about 100 times per second, the top and list commands show which functions and lines cost the most, and each fix was verified by profiling again, which showed where the bottleneck moved next.
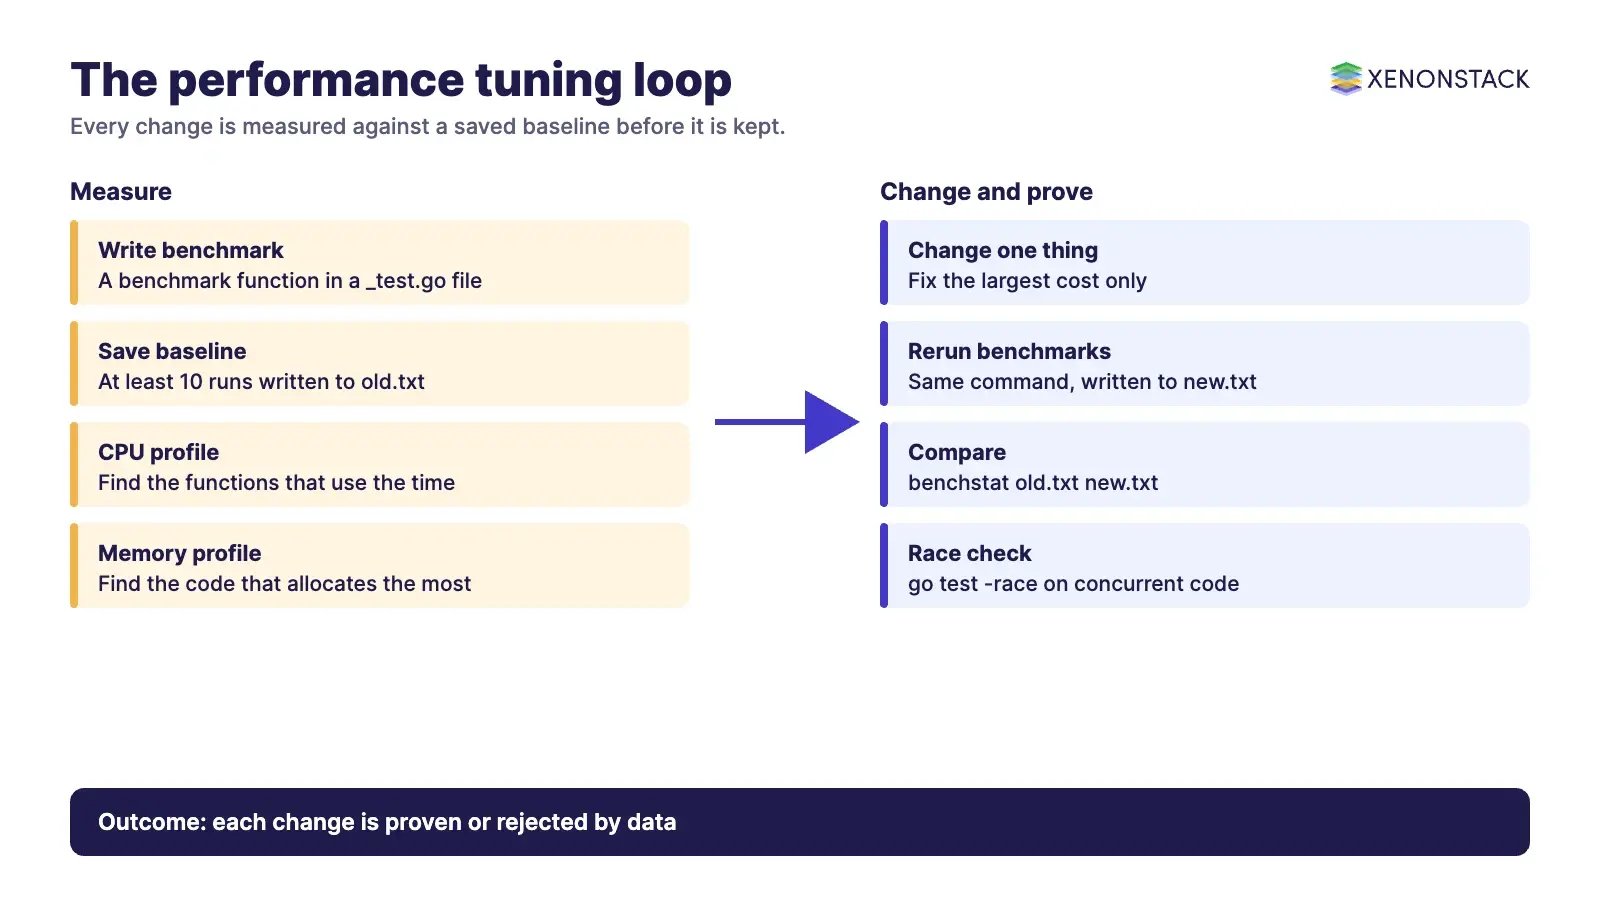
- Write the code and a benchmark function for it in a file ending in
_test.go. - Run the benchmarks several times and save the output to a file, for example
go test -run='^$' -bench=. -count=10 > old.txt. - Profile with
-cpuprofileor-memprofileto see where time and allocations go. - Change one thing, then run the same benchmarks into
new.txt. - Compare the two files with
benchstat old.txt new.txt.
The benchstat documentation describes benchstat as a tool that computes statistical summaries and A/B comparisons of Go benchmarks, and says each benchmark should be run at least 10 times to give a statistically significant sample. It also warns that rerunning benchmarks until a change appears introduces bias, so pick a run count and keep it.
Which tools measure what?
| Question | Tool or technique | What you learn |
|---|---|---|
| Which functions use the CPU? | CPU profile (-cpuprofile, pprof) | Functions and lines ranked by sampled time |
| Which code allocates memory? | Memory profile (-memprofile) | Allocation sites and object counts; heavy allocation can make garbage collection the main cost |
| Did my change help? | Benchmarks compared with benchstat | Median per benchmark and whether the difference is statistically significant |
| Is concurrent code safe? | Race detector (go test -race) | Data races reported with stack traces |
| Where does a request spend time? | Tracing and monitoring | Time across services and cores; see the guide to Go application monitoring |
The Go race detector article defines a data race as two goroutines accessing the same variable concurrently with at least one write, and notes that it only finds races in code paths that actually run. It also states that typical memory use may rise 5 to 10 times and execution time 2 to 20 times under the detector, so use it in tests, not as a production setting.
What are the usual tuning levers beyond one function?
Once a profile points at a layer, the fix depends on the layer. These are general practices, not guarantees, and each should be confirmed by measuring.
| Layer | Typical lever | Check before and after |
|---|---|---|
| Code | Use a simpler data structure, reduce allocation in inner loops | CPU and memory profile |
| Database | Indexes, query review, correct data types | Query time and plans |
| Delivery | Content delivery network, smaller libraries and images | Page and response timings |
| Architecture | Revise configuration and data flow end to end | Response time analysis |
What mistakes make tuning fail?
- Tuning without a baseline, so no one can show the change worked.
- Changing several things at once, so the cause of a gain is unknown.
- Trusting one benchmark run, which is noisy.
- Simplifying code and expecting speed to follow: readability and speed can pull in opposite directions, so measure.
- Optimising code that is not on the hot path.
How do AI agents change performance tuning?
Agents can take over the repetitive parts of the loop: running the benchmark suite on every change, saving the output, running the comparison, reading the profile and proposing the next hypothesis for an engineer to approve. The decision about which trade-off to accept, such as memory for speed, stays with people. To run this kind of agent safely you need clear permissions and an audit trail of what it ran and changed. ElixirClaw is XenonStack's AI agents computing platform for building and operating such agents.
What should you do first?
- Pick one user-visible slowdown and one metric that defines it.
- Write a benchmark for it and save a baseline of at least 10 runs.
- Profile CPU and memory and name the single biggest cost.
- Make one change, rerun, and compare with benchstat.
- Repeat until the metric meets its target, then stop.
To map one decision your agents make, and the data and policy it depends on, book a Context Workshop. See what happens in the workshop.
Frequently asked questions
What is the goal of performance tuning?
The goal is to find the bottleneck that limits speed or resource use, improve it, and prove the improvement with repeatable measurements.
What is the difference between profiling and benchmarking?
Benchmarking measures how fast a piece of code runs. Profiling shows where the time or memory goes inside it. You benchmark to compare versions and profile to decide what to change.
Why should benchmark results be saved to a file?
A saved file is the baseline. Without it you cannot compare a later run against an earlier one, so you cannot show that a change helped.
How many times should a Go benchmark be run?
The benchstat documentation advises at least 10 runs per benchmark to gather a statistically significant sample, and suggests choosing a run count and sticking to it.
Should I run the race detector in production?
No. The Go documentation says typical programs may use 5 to 10 times more memory and run 2 to 20 times slower under it, so it suits tests and realistic load runs.
Ready to put AI agents to work? See an ElixirClaw demo: the agentic OS to build, orchestrate and govern AI agents across your enterprise systems.
Explore the XenonStack platform family: ElixirData · ElixirClaw · ElixirHub · NexaStack · MetaSecure · Neural AI · AgentGRC · AgentSRE · AgentAnalyst · AgentInstruct · AgentRAI · AgentScrum · AgentSearch · AgentForce · AI Aviator · SAIF Aviator · CohortIQ · XenonStack AI · XenonStack UAE