Key takeaway
- Probability forecasting gives a range of outcomes, not one number. Learn how it is built, scored and used in supply chains and by AI agents.
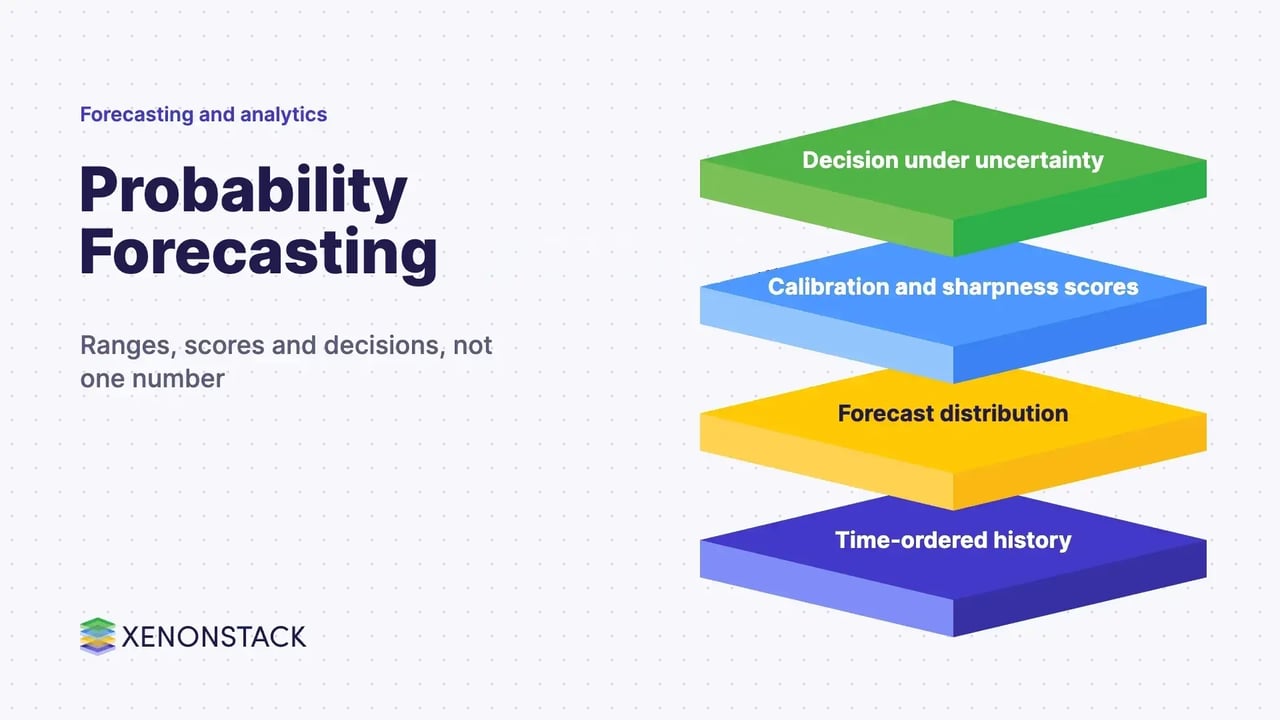
Probability forecasting gives you a range of possible futures with a likelihood attached to each, instead of one number. A point forecast says demand will be 15 units; a probabilistic forecast says how likely 10, 15 or 25 units are, so you can decide how much risk to carry. According to Forecasting: Principles and Practice, the point forecast is the mean of that forecast distribution, so a point forecast is one summary of something larger.
For enterprise leaders the value is in the decision, not the maths: how much stock to hold, how much capacity to reserve, when to escalate to a person. This guide explains how probabilistic forecasts differ from point forecasts, how they are built and scored, where they fit in supply chains, and how to use them with AI agents. It builds on our guides to forecasting methods and predictive analytics.
What is probability forecasting, and how does it differ from a point forecast?
A probabilistic forecast takes the form of a predictive probability distribution over future quantities. That is the opening line of the abstract of Gneiting and Katzfuss, "Probabilistic Forecasting", in the Annual Review of Statistics and Its Application, as shown on the Annual Reviews page. The same abstract says such forecasting aims to maximise the sharpness of the predictive distributions, subject to calibration.
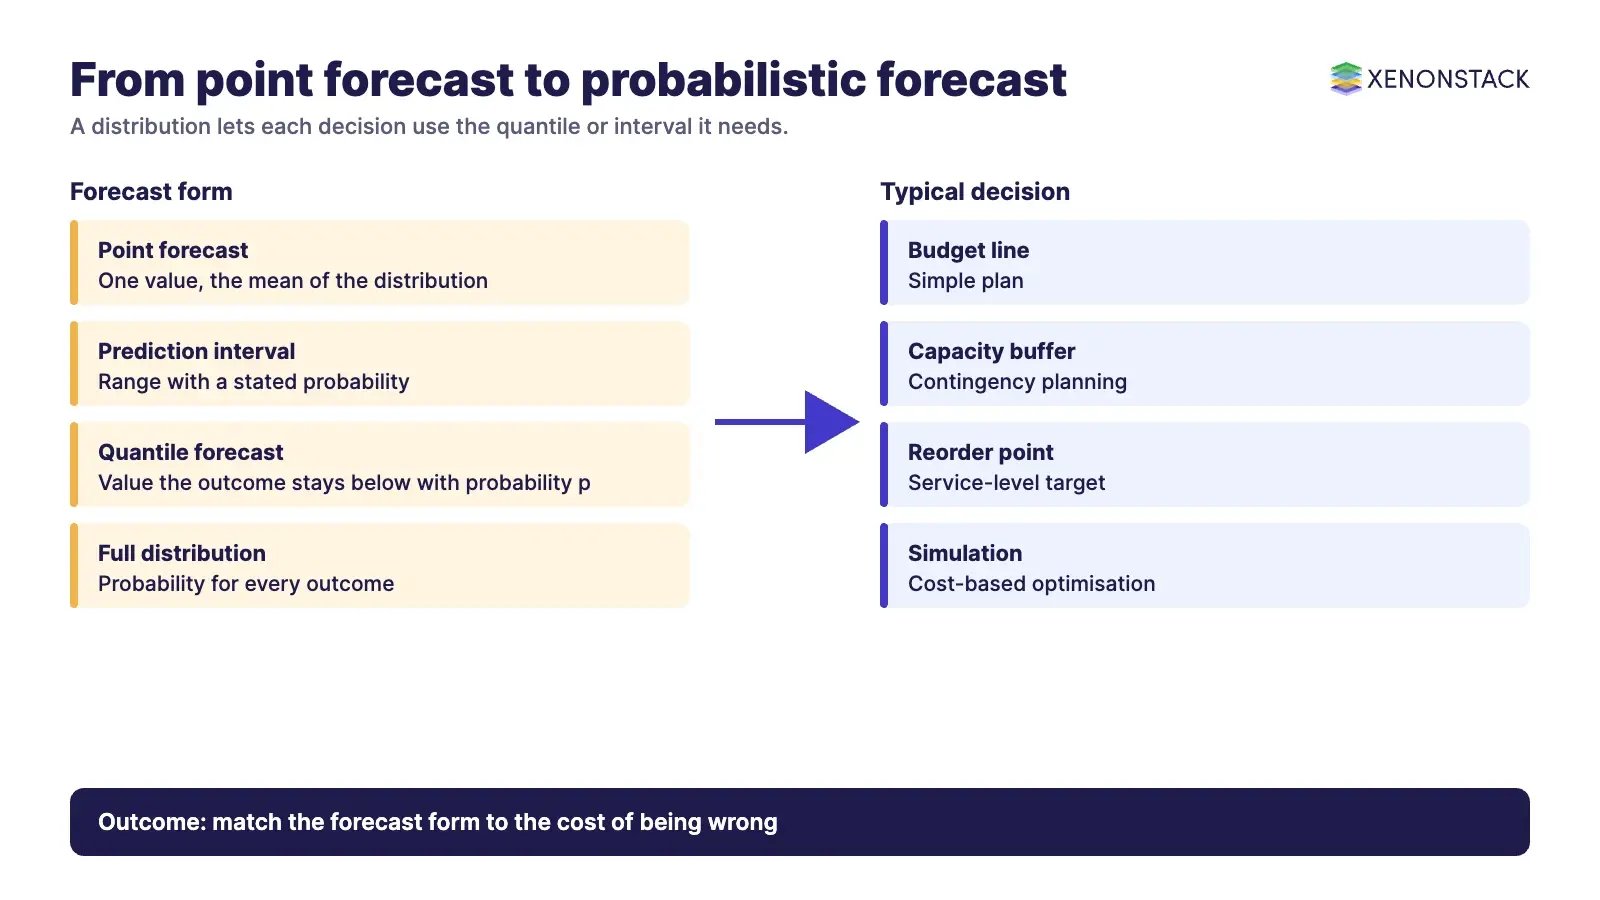
There are several ways to express a distribution, and each suits a different decision.
| Form | What it tells you | Typical decision |
|---|---|---|
| Point forecast | One value, usually the mean of the forecast distribution | Budget line, simple plan |
| Prediction interval | A range expected to contain the outcome with a stated probability, for example 80% or 95% | Contingency planning, capacity buffers |
| Quantile forecast | The value the outcome stays below with probability p, for example the 90th percentile | Reorder points, service-level targets |
| Full distribution | A probability for every possible outcome | Cost-based optimisation, simulation |
Many people hear "probability" and assume a forecast is only about odds of an event. In practice the term covers a whole distribution of values, so a single demand number, a range and a stock-out risk all come from the same object.
Why do supply chains use probability forecasting for demand planning?
Supply chains face uncertainty in demand, supply and transit that planning cannot remove. A probabilistic view lets you price that uncertainty rather than hide it inside a single average. It works best where the decision has asymmetric costs: running out of a part may cost far more than holding an extra one, and the right stock level depends on the shape of demand, not only its mean.
Inventory is the clearest case. To set a reorder point on a reasoned basis you need the distribution of demand over the replenishment lead time, and both demand and lead time vary. A point forecast cannot tell you how far above the average to set the point for a target service level; a quantile of the lead-time demand distribution can. Our guides to supply chain analytics and supply chain management cover the wider planning context, and agentic AI in the supply chain covers how agents act on these signals.
Which supply chain quantities suit a probabilistic forecast?
| Quantity | Why uncertainty matters | What a distribution adds |
|---|---|---|
| Demand | Erratic or intermittent items, launches and promotions make the average a poor guide | A stock level for a chosen service target |
| Lead time | Overseas imports vary by origin, route and port; a stock-out can also lengthen local supplier lead times | Safety buffer sized to the spread, not a fixed number of days |
| Yield | For fresh food, weather and other factors outside the company's control drive yield and quality | Season-wide range for procurement and pricing |
| Returns | Ordering one item in several sizes makes some returns likely | Expected return volume and financial loss per order |
How is a probabilistic forecast built?
The exact steps depend on the model, but the sequence below holds for most teams.
- Define the decision. Decide what the forecast must support, such as a reorder point or capacity plan, and which quantile or interval it needs.
- Collect and clean data. Gather history for the target and its drivers, and handle missing values and outliers.
- Choose a model family. Pick a method that can express uncertainty: see the table in the next section.
- Fit and produce distributions. Estimate parameters, then generate forecast distributions, intervals or quantiles for each horizon.
- Evaluate on unseen data. Compare forecasts with actual outcomes on held-out periods using the scores below, and compare against a simple benchmark.
- Improve. Adjust features, the model or the data, and repeat the evaluation.
- Deliver and monitor. Present ranges in terms the decision-maker uses, refresh as new data arrives and watch calibration over time.
If the series is a time series, time series analysis covers stationarity, ARIMA and related models in more depth.
Which methods produce probabilistic forecasts?
Most time series models produce normally distributed forecasts, according to Forecasting: Principles and Practice. With that assumption, a 95% interval is the point forecast plus or minus 1.96 times the estimated standard deviation of the forecast distribution. When normal residuals are unreasonable, the same source describes bootstrapping, which builds intervals from percentiles of simulated future sample paths and gives intervals that are not symmetric.
| Approach | How uncertainty is produced | When it fits |
|---|---|---|
| Statistical time series models (exponential smoothing, ARIMA) | Forecast distribution, usually assumed normal, with a standard deviation that grows with the horizon | Series with stable structure and enough history |
| Bootstrapped residuals | Simulated future paths, with intervals taken as percentiles | Residuals are not normal but are roughly uncorrelated with constant variance |
| Quantile regression and machine learning with a quantile loss | The model is trained to output chosen quantiles directly, using the pinball loss | Many drivers, non-linear effects and enough data to train on |
| Bayesian models | Prior beliefs are updated with data through Bayes' theorem, giving a posterior distribution | Little data, or expert knowledge worth encoding |
| Ensembles | Several forecasts or simulations combined into a spread of outcomes | Forecasts from several models or scenarios need combining |
Choose by the data you have and the decision you support, not by the algorithm name. A statistical model that is understood and well calibrated often beats a complex model that is not, so always compare against a simple benchmark.
How do you judge whether a probabilistic forecast is good?
Gneiting and Katzfuss frame the goal as sharpness subject to calibration. Calibration means that when you say 80% the outcome falls inside the range about 80% of the time. Sharpness means the ranges are as narrow as that calibration allows. They also note that probabilistic calibration can be checked with probability integral transform (PIT) histograms, and that proper scoring rules such as the logarithmic score and the continuous ranked probability score assess calibration and sharpness together.
| Measure | What it does | Source note |
|---|---|---|
| Quantile score (pinball loss) | Scores a single quantile forecast; lower is better; at p = 0.5 it equals the absolute error | Defined in the distributional accuracy section of Forecasting: Principles and Practice |
| CRPS | Averages quantile scores over all values of p, like a weighted absolute error over the whole distribution | Same section |
| Winkler score | Interval width plus a penalty when the outcome falls outside the interval | Same section |
| Skill score | Compares a method's score with a benchmark such as the naive method; negative means worse than the benchmark | Same section |
| PIT histogram | A visual check of calibration | Gneiting and Katzfuss abstract |
Sources: distributional forecast accuracy and the Annual Reviews abstract above. Because a single probability forecast cannot be judged alone, reliability is assessed over many forecasts together.
What are the benefits of probability forecasting, and when is it not worth it?
| Benefit | Why it follows from the method | Trade-off or limit |
|---|---|---|
| Risk is visible | The range and tail probabilities show how bad a shortfall could be | Stakeholders need to read ranges, not only a number |
| Better inventory and capacity decisions | Quantiles map to service-level targets | Needs lead-time and demand distributions, not just means |
| Honest handling of error | Missing the single most likely value is expected, and the distribution says how often | Intervals that are too narrow give false comfort, so check calibration |
| Fewer arguments over one number | Planning teams share assumptions about uncertainty | More outputs to govern and explain |
| Resource allocation | Spare capacity can be released where risk is low | Requires discipline to act on ranges consistently |
It is not always worth the effort. For stable, low-value items with cheap shortfalls, a simple point forecast and a fixed buffer may be enough. Probabilistic forecasting pays back where errors are costly and demand or lead time is volatile.
How do AI agents use probabilistic forecasts?
An agent that places orders, reallocates stock or flags exceptions needs more than a number. A forecast distribution lets it act on a quantile when the range is tight and escalate to a person when the range is wide or the cost of being wrong is high. Governance then has something concrete to check: which forecast version, which quantile, which policy and who approved the exception.
| Agent step | Use of the forecast distribution | Control to keep |
|---|---|---|
| Replenishment | Order to a chosen quantile of lead-time demand | Policy sets the service target and spend limits |
| Exception handling | Escalate when the interval widens beyond a threshold | Human approval above defined limits |
| Review | Compare outcomes with forecast ranges | Calibration monitoring and a record of each decision |
See our guides to agentic workflows and agentic AI in supply chain for patterns and governance. ElixirData Context OS keeps governed context, versioned policy and decision traces in one decision layer above AI agents, and AgentAnalyst lets teams ask questions of enterprise data in plain language and get real-time insights.
How should an enterprise adopt probability forecasting?
- Pick one costly decision. For example, reorder points for volatile items, where a shortfall is expensive.
- Keep the point forecast as a benchmark. Measure the probabilistic model against it and against a naive method.
- Score calibration and sharpness. Use pinball loss or CRPS on held-out periods, and check that stated ranges match outcomes.
- Translate ranges into policy. Set service targets, thresholds and approval limits that planners and agents follow.
- Monitor and widen. Track calibration over time and extend to more items only when it holds.
To map one forecast-driven decision your agents should make, and the context and policy it depends on, book a Context Workshop. See what happens in the workshop.
Frequently asked questions
What is probability forecasting?
Probability forecasting produces a predictive probability distribution over future quantities rather than a single value. The point forecast is the mean of that distribution, and intervals and quantiles are read from it.
What is the difference between a point forecast and a probabilistic forecast?
A point forecast gives one value. A probabilistic forecast gives the range of outcomes and how likely each is, so you can see the risk of a shortfall and set buffers to a target service level.
How is a probabilistic forecast evaluated?
By calibration and sharpness. Calibration checks that stated probabilities match outcomes, for example with PIT histograms. Scores such as pinball loss, CRPS and the Winkler score measure quality, and a skill score compares a method with a benchmark.
Which models give probabilistic forecasts?
Most statistical time series models give normally distributed forecasts. Bootstrapping, quantile regression, Bayesian models and ensembles are alternatives when normality is a poor assumption or many drivers are involved.
Why does probability forecasting help inventory management?
Reorder points depend on the distribution of demand over the replenishment lead time. A quantile of that distribution sets a buffer for a chosen service level, which a single average cannot do.
Is probability forecasting always better than a point forecast?
No. For stable, low-value items a point forecast with a fixed buffer can be enough. The extra effort pays back where shortfalls are costly and demand or lead time is volatile.
Ready to put AI agents to work? See an ElixirClaw demo: the agentic OS to build, orchestrate and govern AI agents across your enterprise systems.
Explore the XenonStack platform family: ElixirData · ElixirClaw · ElixirHub · NexaStack · MetaSecure · Neural AI · AgentGRC · AgentSRE · AgentAnalyst · AgentInstruct · AgentRAI · AgentScrum · AgentSearch · AgentForce · AI Aviator · SAIF Aviator · CohortIQ · XenonStack AI · XenonStack UAE