Key takeaway
- Spark performance tuning for 2027: AQE, partition sizing, broadcast joins, skew, caching, Kryo, memory and executor settings, with Spark 4.3 defaults.
Spark performance tuning is the work of making Apache Spark jobs finish faster and cheaper by cutting unnecessary shuffles, sizing partitions and executors correctly, choosing the right join strategy, caching only what is reused and giving the JVM enough memory to avoid long garbage collection pauses. In current Spark releases, much of this is automated: Adaptive Query Execution (AQE) has been on by default since Spark 3.2.0 and re-plans queries at runtime using real shuffle statistics.
The current release is Spark 4.3.0, published on 30 October 2026. For enterprise teams, the practical order is: measure first in the Spark UI, fix data layout and joins, let AQE handle partition coalescing and skew, and only then adjust memory, serialisation and executor settings. This guide gives the techniques, the defaults they change and when each one is worth the effort.
What is Spark performance tuning?
Apache Spark is a distributed processing engine. A driver program turns your code into a plan of stages and tasks, and executors run those tasks in parallel, one task per data partition. For the full picture of drivers, executors and cluster managers, see our guide to Apache Spark architecture.
Most slow Spark jobs have one of five causes: too much data moved across the network in shuffles, partitions that are too large or too small, one or two skewed partitions that hold most of the data, memory pressure that causes spills and garbage collection pauses, or reading far more data than the query needs. Spark optimisation techniques target these causes. The official Spark tuning guide and SQL performance tuning guide are the primary references used throughout this article (both read at version 4.3.0).
What has changed in Spark tuning since Spark 3?
Older tuning advice was written for Spark 1.x and 2.x, when engineers set most parameters by hand. Several defaults have since changed, and some advice no longer applies.
| Change | What it means for tuning | Current status |
| Adaptive Query Execution on by default | Spark coalesces small shuffle partitions, splits skewed partitions and converts sort-merge joins to broadcast joins at runtime | Default since Spark 3.2.0 (spark.sql.adaptive.enabled=true) |
| JDK 17 and G1GC by default | G1 is now the default garbage collector, so manual collector switching is rarely needed; large heaps may need a bigger G1 region size | Since Spark 4.0.0 |
| Storage partition join | Avoids the shuffle before a join by using the existing storage layout of compatible V2 tables, generalising bucket joins | Available since Spark 3.3.0, extended in 4.0.0 |
| Arrow-optimised Python UDFs | Faster data transfer between the JVM and Python for regular Python UDFs | On by default since Spark 4.2 |
| Sort-merge to shuffled hash join conversion in AQE | AQE can choose a shuffled hash join when post-shuffle partitions are small enough | New setting in Spark 4.3.0, default true |
| Spark Connect | Thin clients use DataFrames only; RDD-level tuning does not apply | Spark Connect does not support RDDs or SparkContext |
The practical consequence: on Spark 3.2 and later, start with the DataFrame and SQL APIs, check that AQE is still enabled, and tune from evidence rather than copying old configuration files. Our guide to RDDs in Spark explains when the lower-level RDD API is still the right choice.
Which Spark optimisation techniques matter most?
The table below summarises the main techniques, when each fits and the setting or default involved. The sections that follow explain each one.
| Technique | When it fits | Key setting (default in 4.3.0) |
| Reduce shuffles | Aggregations and joins dominate stage time | Prefer reduceByKey or DataFrame aggregations over groupByKey |
| Right-size partitions | Many tiny tasks or a few very long ones | spark.sql.files.maxPartitionBytes (128 MB), spark.sql.shuffle.partitions (200) |
| Broadcast small tables | One side of a join is small | spark.sql.autoBroadcastJoinThreshold (10 MB) |
| Handle skew | A few tasks run far longer than the rest | spark.sql.adaptive.skewJoin.enabled (true) |
| Filter pushdown and columnar formats | Queries read a fraction of columns or rows | spark.sql.parquet.filterPushdown (true) |
| Selective caching | The same data is reused across actions or iterations | cache(), persist(), unpersist() |
| Kryo serialisation | RDD or JVM-object-heavy jobs that shuffle or cache serialised data | spark.serializer (Java serialiser by default) |
| Memory and GC tuning | Spills, out-of-memory errors or long GC time in the UI | spark.memory.fraction (0.6) |
| Executor sizing and dynamic allocation | Variable workloads on shared clusters | spark.dynamicAllocation.enabled (false) |
Reduce shuffles
A shuffle redistributes data across partitions, which means disk I/O, serialisation and network I/O. The RDD programming guide describes shuffles as complex and costly, and they are triggered by repartition and coalesce operations, ByKey operations such as groupByKey and reduceByKey, and joins. For key-based aggregation, reduceByKey or aggregateByKey combine values within each partition before the shuffle, so far less data crosses the network than with groupByKey. On DataFrames, built-in aggregations get this behaviour automatically.
Right-size partitions
For file sources such as Parquet, JSON and ORC, spark.sql.files.maxPartitionBytes (default 128 MB) controls how much data goes into each read partition. After a shuffle, spark.sql.shuffle.partitions sets the starting number of partitions (default 200). With AQE enabled, Spark coalesces small post-shuffle partitions automatically, aiming at spark.sql.adaptive.advisoryPartitionSizeInBytes (default 64 MB). Note that with spark.sql.adaptive.coalescePartitions.parallelismFirst at its default of true, Spark favours parallelism and ignores the advisory size; the documentation recommends setting it to false on busy clusters. For RDD work, the tuning guide recommends 2 to 3 tasks per CPU core in the cluster.
Choose the right join strategy
When one side of a join is smaller than spark.sql.autoBroadcastJoinThreshold (default 10 MB), Spark sends a copy of it to every executor and avoids shuffling the large side. AQE can make the same switch at runtime when the actual size of a join side falls under the threshold. You can also guide the optimiser with join hints: BROADCAST, MERGE, SHUFFLE_HASH and SHUFFLE_REPLICATE_NL, although Spark does not guarantee the hinted strategy for every join type. For large tables joined repeatedly on the same keys, bucketed tables or a storage partition join on compatible V2 sources (for example Apache Iceberg tables) can remove the shuffle before the join entirely.
Handle data skew
Skew happens when a few keys hold most of the rows, so one task runs for minutes while the others finish in seconds. With AQE skew join handling on (the default), Spark treats a partition as skewed when it is larger than 5 times the median partition size and larger than 256 MB, then splits it into smaller tasks. If skew persists, look at the data: salting hot keys or filtering nulls before a join often helps more than any setting.
Push filters down and use columnar formats
Reading less data is the cheapest optimisation. Columnar formats such as Parquet let Spark read only the columns a query needs, and Parquet filter pushdown (spark.sql.parquet.filterPushdown, default true) skips data that cannot match the filter. Spark writes Parquet with Snappy compression by default. Partition tables on low-cardinality columns that queries filter on, such as date, and check the physical plan with explain() to confirm filters reach the data source.
Cache only what you reuse
Caching helps when the same DataFrame or RDD is used by several actions, such as iterative machine learning or a cleaned dataset feeding several reports. Use dataFrame.cache() or spark.catalog.cacheTable("tableName"), and release memory with unpersist() or uncacheTable() when you are done. The tuning guide's advice is clear: if memory is tight, it is better to cache fewer objects than to slow down task execution. For storage level choices, see the persistence section of our Spark RDD guide.
Switch to Kryo serialisation where it applies
Spark serialises objects with Java serialisation by default, which the tuning guide calls flexible but often quite slow. Kryo "is significantly faster and more compact than Java serialization (often as much as 10x)", but it does not support every Serializable type and works best when you register your classes. Set spark.serializer to org.apache.spark.serializer.KryoSerializer. This matters most for RDD and JVM-object workloads.
Tune memory and garbage collection
Spark divides executor memory into a unified region for execution and storage. spark.memory.fraction (default 0.6) sets that region as a share of the JVM heap minus 300 MiB, and spark.memory.storageFraction (default 0.5) protects part of it for cached blocks. The tuning guide says most users should not need to change these. Since Spark 4.0.0, Spark runs on JDK 17 by default, which makes G1GC the default collector; with large executor heaps, increase the G1 region size with -XX:G1HeapRegionSize. If tasks fail with out-of-memory errors in a reduce stage, the simplest fix is usually more parallelism, so each task's working set is smaller.
Size executors and use dynamic allocation
spark.executor.cores defaults to 1 on YARN and to all available worker cores in standalone mode, and spark.executor.memory defaults to 1 GB, so production jobs almost always need explicit values. Dynamic allocation (spark.dynamicAllocation.enabled, default false) scales executors up and down with the workload; it needs shuffle tracking, an external shuffle service or shuffle block decommissioning, and shuffle tracking is on by default. On shared clusters it stops idle executors from holding resources. Speculative execution (spark.speculation, default false) relaunches slow tasks and can help on clusters with uneven nodes.
Respect data locality
Spark tries to run each task where its data already is, stepping from process-local to node-local, rack-local and then any node. spark.locality.wait (default 3 seconds) sets how long it waits before falling back to a less local level. The documentation advises increasing it only if tasks are long and show poor locality.
Use Apache Arrow for PySpark
Apache Arrow is an in-memory columnar format that Spark uses to move data efficiently between the JVM and Python processes. The PySpark Arrow guide states that Arrow is enabled by default for toPandas() and createDataFrame() from pandas, and since Spark 4.2 regular Python UDFs are Arrow-optimised by default. For heavy Python logic, pandas UDFs and functions such as applyInPandas process data in vectorised batches rather than row by row.
Bound state in Structured Streaming with watermarks
In streaming aggregations, state grows without limit unless you tell Spark how late data may arrive. withWatermark("timestamp", "10 minutes") sets the event-time column and the lateness threshold, so Spark can drop old window state; late data within the threshold is still aggregated. Watermarks work with Append and Update output modes; Complete mode keeps all aggregate data and cannot use a watermark to drop state. For a worked streaming example, see our guide to building a real-time streaming application with Apache Spark.
How do you find what is slowing a Spark job?
Tune from evidence. According to the Spark monitoring guide, every application starts a web UI, by default on port 4040, showing jobs, stages, tasks, storage and executors. Set spark.eventLog.enabled to true so the History Server (port 18080 by default) can show finished applications, and use the REST API at /api/v1 or the Prometheus executor metrics endpoint to feed your observability stack.
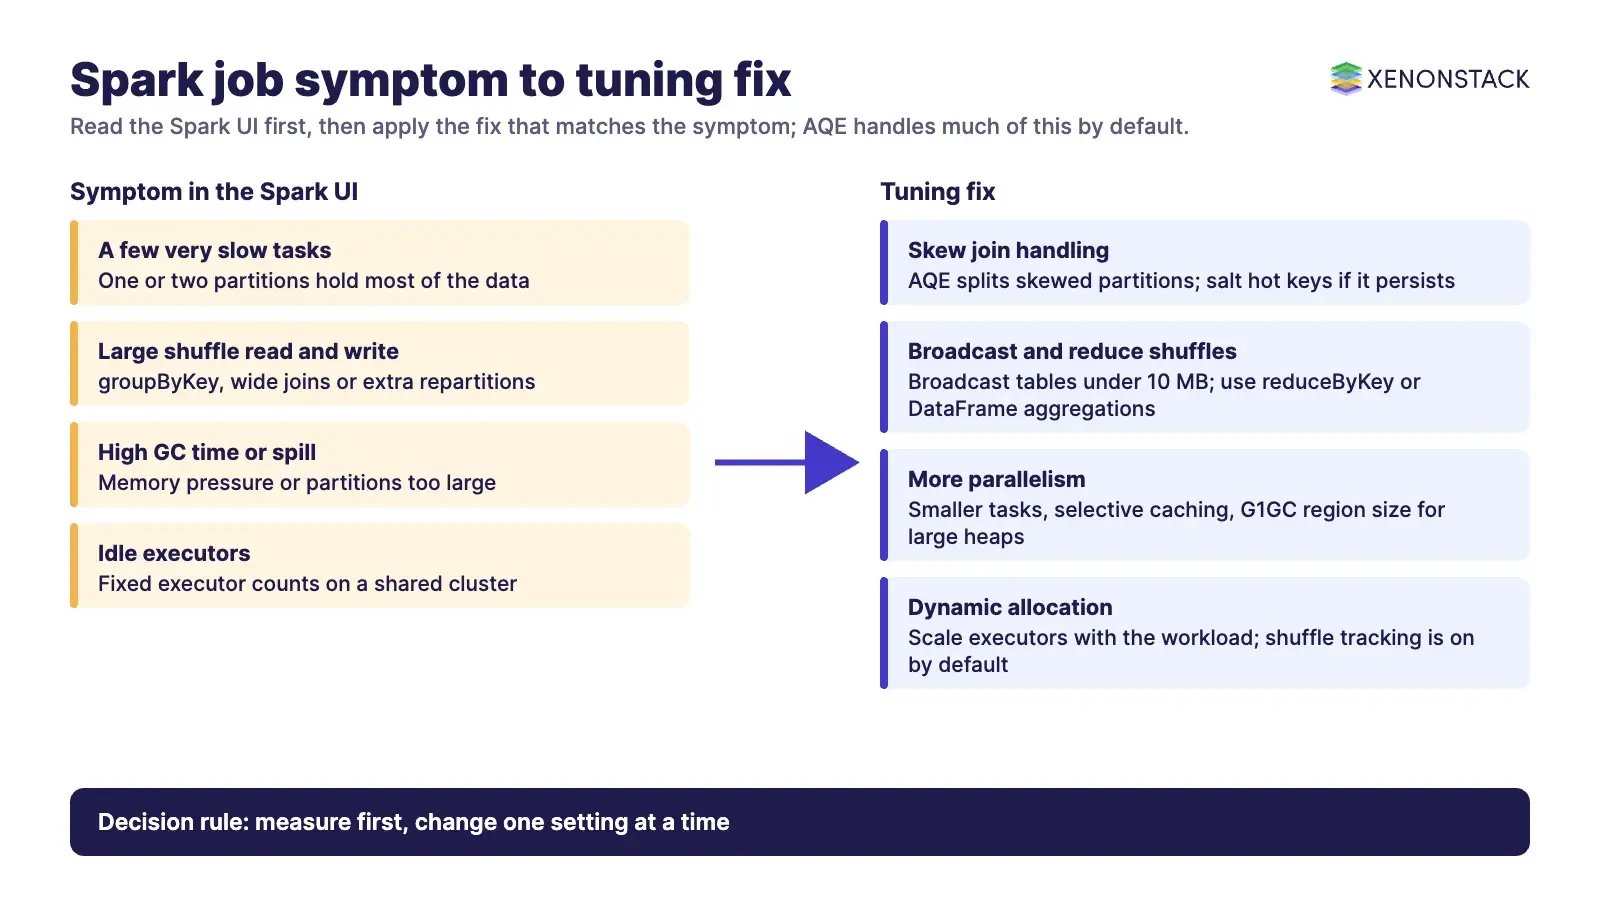
In the UI, look for stages where a few tasks take much longer than the median (skew), large shuffle read and write volumes (too many shuffles), high GC time (memory pressure) and spill to disk (partitions too large). Then check the query plan with explain() to see join strategies and whether filters are pushed down.
How do governance, security and cost fit into Spark tuning?
For leaders, Spark tuning is mainly a cost and reliability decision. Dynamic allocation, right-sized executors and reading less data reduce compute spend directly. The risk is uncontrolled change: a configuration copied from one job to another, or a broadcast threshold raised until a driver runs out of memory.
Treat configuration as code: keep Spark settings in version control with the job, review changes and record why each non-default value exists.
Test on representative data: partition sizes, skew and join choices depend on real volumes, so benchmark on production-like data before rollout.
Protect logs and metrics: event logs and the History Server expose query plans and job details, so restrict access to them as you would to the data itself.
Set cost guardrails: cap maximum executors per job and alert on jobs whose runtime or shuffle volume jumps after a change.
As Spark pipelines increasingly feed AI agents and automated decisions, the tuning record becomes part of the decision record too. ElixirData Context OS keeps governed context, versioned policy and decision traces in one decision layer above AI agents.
In what order should enterprise teams tune Spark?
Upgrade and baseline: move to a supported Spark 4.x release where possible, confirm AQE is enabled and record runtime, cost and shuffle volume for the jobs that matter most.
Fix the data layout: use columnar formats, partition on common filters and compact small files.
Fix joins and shuffles: broadcast small tables, replace
groupByKeypatterns and remove unnecessary repartitions.Address skew: rely on AQE first, then salt or pre-aggregate hot keys if needed.
Right-size compute: set executor cores and memory explicitly and enable dynamic allocation on shared clusters.
Fine-tune last: adjust serialisation, memory fractions, GC and locality only when the UI shows a specific problem.
Monitor continuously: keep event logs, alert on regressions and review the top jobs by cost each quarter.
What are the trade-offs, and when should you not tune?
| Choice | Benefit | Trade-off |
| Raising the broadcast threshold | Fewer shuffled joins | More driver and executor memory per broadcast; risk of out-of-memory errors |
| Aggressive caching | Faster reuse of the same data | Less memory for execution, more spills and GC |
| More shuffle partitions | Smaller tasks, fewer spills | Scheduling overhead and small output files |
| Large executors | Fewer JVMs, more shared memory | Longer GC pauses and coarser scaling |
| Join hints | Predictable plans | Hints can go stale as data grows; AQE may choose better at runtime |
Do not tune a job that already meets its service level and cost target, and do not tune before measuring. Hand-set values that made sense on Spark 2 can override better runtime decisions from AQE on Spark 3.2 and later. Once data is fast and well laid out, teams can also open it to business users: AgentAnalyst lets teams ask questions of enterprise data in plain language and get real-time insights.
What should leaders take away?
Spark optimisation in 2026 is less about memorising settings and more about letting the engine's runtime optimiser do its job, then removing the causes it cannot fix: poor data layout, unnecessary shuffles, skewed keys and oversized or idle compute. Measure in the Spark UI, change one thing at a time and keep every non-default setting under review.
To map one Spark-fed decision your agents should make, and the context and policy it depends on, book a Context Workshop. See what happens in the workshop.
Related on XenonStack
- DataOps AI agents: pipelines that monitor and fix themselves.
- ElixirData: governed context for enterprise AI agents.
- Agentic AI with Snowflake: agents on your data cloud.
What should you plan for in 2027?
Two items on the Apache Spark release calendar shape upgrade planning for the year.
- November 2027: the versioning policy lists Spark 3.5.x extended long term support as running until November 2027, with security fixes only. Teams still on 3.5 should schedule a move to a supported 4.x release before then (Spark versioning policy).
- 2027 release cadence: the same page uses a Spark 5.0.0 major release in 2027, followed by quarterly 5.x feature releases, as an illustrative schedule. It gives no exact dates, so treat it as a planning assumption and confirm it when dates are announced (Spark versioning policy).
Check again the defaults in this guide against the release you run, because defaults can change between feature releases.
Frequently asked questions about Spark performance tuning
Is Adaptive Query Execution enabled by default in Spark?
Yes. AQE has been enabled by default since Spark 3.2.0. It coalesces small post-shuffle partitions, splits skewed partitions in joins and can convert sort-merge joins to broadcast or shuffled hash joins at runtime.
What is the default number of shuffle partitions in Spark?
The default for spark.sql.shuffle.partitions is 200. With AQE enabled, Spark coalesces small post-shuffle partitions automatically, so the starting number matters less than it did before Spark 3.
When does Spark use a broadcast join?
Spark broadcasts a join side automatically when it is smaller than spark.sql.autoBroadcastJoinThreshold, which defaults to 10 MB. You can also request it with the BROADCAST hint, and AQE can switch to a broadcast join at runtime.
Should I use Kryo serialisation?
For RDD and JVM-object-heavy jobs, usually yes. The Spark tuning guide says Kryo is often as much as 10 times faster and more compact than Java serialisation, but it does not support all Serializable types and works best with registered classes.
Which garbage collector does Spark 4 use?
Since Spark 4.0.0, Spark uses JDK 17 by default, which makes G1GC the default garbage collector. With large executor heaps, increasing the G1 region size can help.
How do I find the cause of a slow Spark job?
Open the Spark web UI (port 4040 by default) or the History Server for finished jobs. Look for skewed task times, large shuffle volumes, high GC time and disk spill, then check the query plan with explain().
Follow XenonStack on LinkedIn: XenonStack on LinkedIn for new guides on agentic AI, data and platform engineering.
Ready to put AI agents to work? Explore ElixirClaw, the agentic OS platform to build, orchestrate and govern AI agents.
Explore the XenonStack platform family: ElixirData · ElixirClaw · ElixirHub · NexaStack · MetaSecure · Neural AI · AgentGRC · AgentSRE · AgentAnalyst · AgentInstruct · AgentRAI · AgentScrum · AgentSearch · AgentForce · AI Aviator · SAIF Aviator · CohortIQ · XenonStack AI · XenonStack UAE