Overview of APIs Latency
In Systems as software, usage of APIs is very important. For monitoring purposes, there are still many gaps available. There is a significant drawback where developers get to know that API's also fail to respond sometimes. If the API's fail, there is some downfall in the application performance testing the Client rather than the provider of the API's used in the application. When an API fails, developers and team spends a lot of time fixing the unconcerned issues while checking the API's.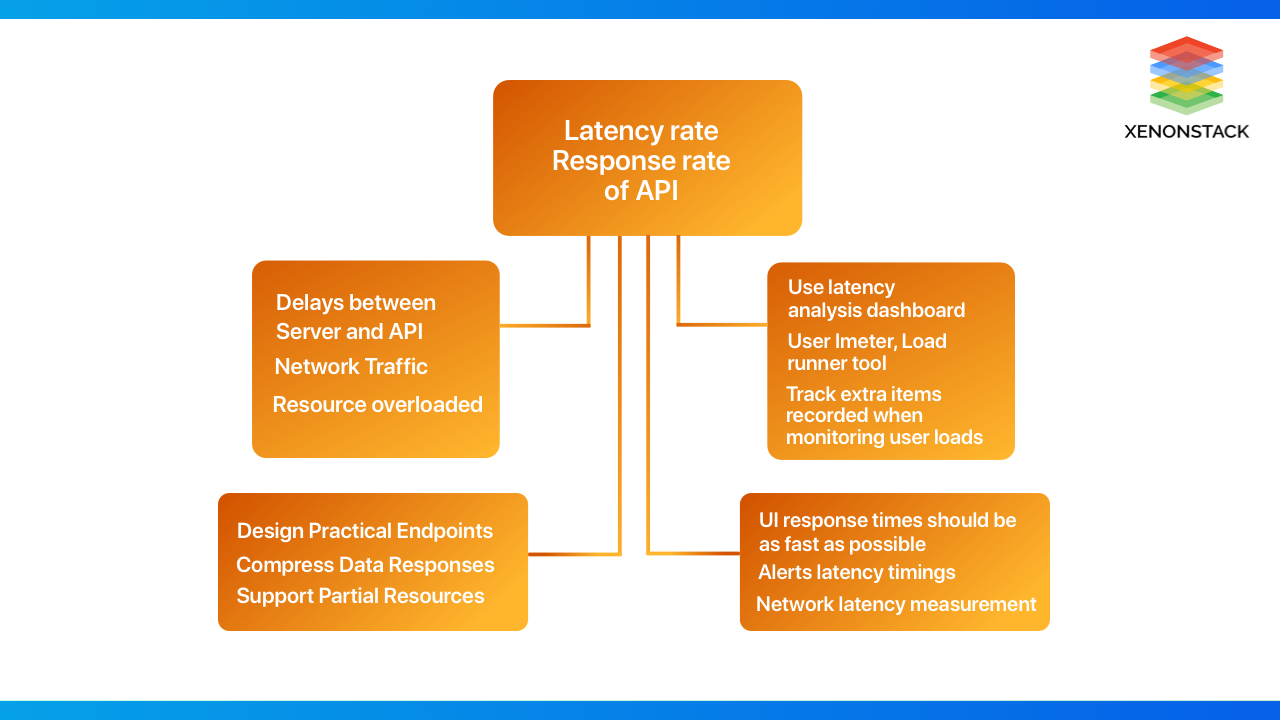
What is the Latency Rate?
API latency is the total time the API system takes to respond to API calls. This time is counted from the time API Gateway receives the request to the exact time the first response is sent to this same client. This is the delay experienced by the user after starting the web service or after an action performed in the mobile application or software while operating in a session. Maintaining acceptable API latency is a big challenge for application companies. High latency directly impacts the speed and performance of mobile apps or software applications.
An application programming interface API Testing attempts to connect an application to the web and different APIs. Click to explore about, API Testing Tools and Best Practises
Causes of Latency
Latency is the time that a message spends "on the network" Here, the shorter the number, the better. The delay may be due to the connection between the server and the API server. This could also be due to the delay between the server and the API server. This can result from network traffic or resource overload, though the acceleration requests can handle heavy loads.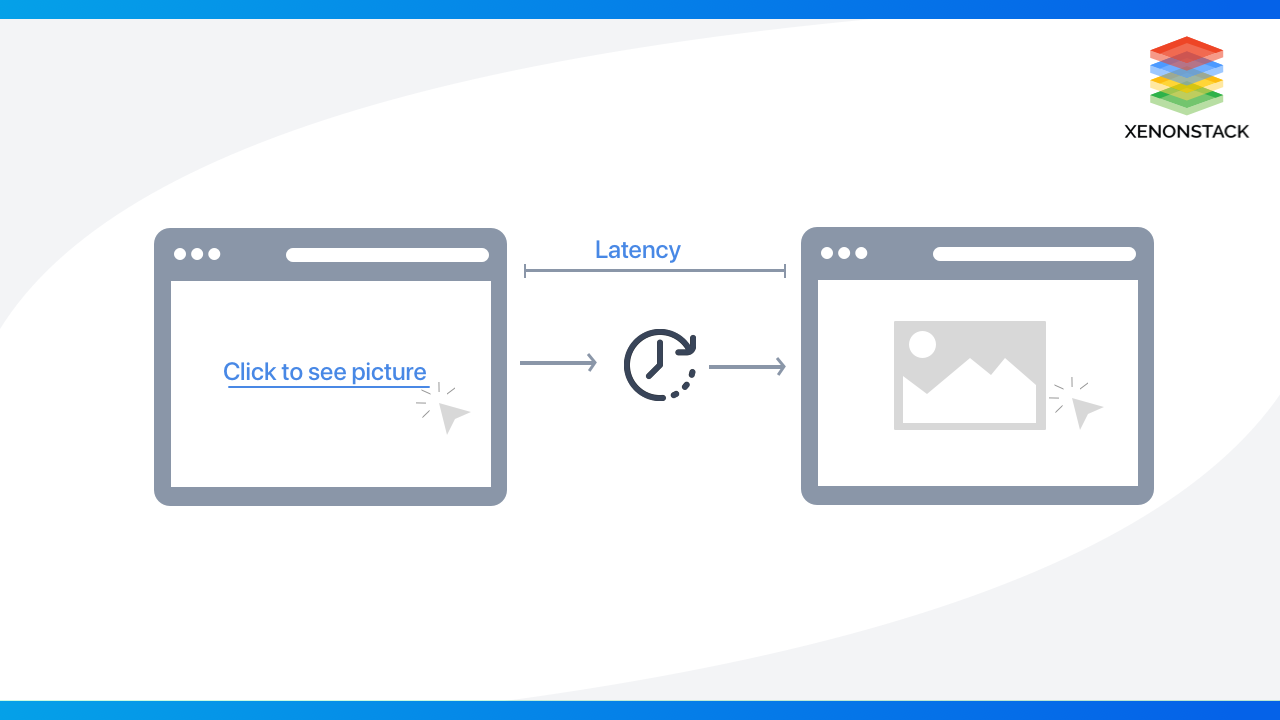
The extra milliseconds may seem modest, but this is exacerbated by all backend communication, total size, and page load time required by the client and server to establish a connection. There are also problems with the network of devices through which the data passes. The time it takes for a client request to respond to a client device is mentioned as round trip time. The Latency is when the computer receives a data request to request the response server. This includes the time it takes for a byte of data to be transferred from the responding computer to the requesting computer. This is usually measured as a round-trip delay.
Monitor the Latency of API
To track latency, the web service needs to track the timestamps of outbound and inbound requests and compare them to past and future requests at a given time. This can be even more complicated because the response time also affects the server response. If so, pinging the endpoint or calling the health check endpoint might be the best way to get an accurate latency estimate.
This review is helpful when deploying servers geographically. The company can decide which provider to choose by determining the minimum latency. If you determine that the delay is the actual cause of the response, you can select a specific zone carrier service or choose a different provider if resource response time is an issue. In practice, latency and response time are often combined into a single value.
API proxies decouple the app-facing API from your backend services, shielding those apps from backend code changes. Click to explore about, Understanding APIs and API proxies
Latency Analysis Dashboard (LAD)
The LAD refers to the Latency Analysis Dashboard, which can alert you to potential latency issues with API proxies. Delay measurements up to the 1-minute window highlight the mean, 95th, and 99th percentile. The average shows when half of the traffic is active. Traffic delays are less than this value, and half of the traffic is delayed above this value. For example, if the selected API proxy has an average response time of 62ms, half of the responses from that API proxy were less than 62ms.
It also means that half of the response from this API proxy takes more than 62ms. The 95th and 99th percentiles indicate where 95% and 99% of traffic lags below these values. More importantly, it shows device behaviour and can indicate that 5% and 1% of traffic are experiencing out-of-range latency values.
To check the LAD, go through the below-mentioned steps -
-
Login in through this link - https://apigee.com/edge.
-
Go through the flow - Analyze > API Metrics > Latency Analysis.
What does this dashboard measure?
|
Metric
|
Description
|
|
Response Time
|
The total amount of time the server takes to answer the call by taking both API proxy and responding server.
|
|
API Target Response Time
|
The responding server takes the response time for an API call by mentioning the server's performance for the call response.
|
|
Request Processing Latency
|
It provides the final amount of time by adding the delay in a request and response to an API call. It gives the exact amount of time for a call to the destination and a call to come back to the API.
|
Some measures point to Reduce Latency
The below highlighted are some measure points to reduce latency:
Need to develop efficient Endpoints
The first and most design-based way to speed up your API is to create a convenient user-centric endpoint. This doesn't reduce latency in itself, but it reduces the number of calls a developer has to make, reduces the cumulative latency of those calls, and makes the API run faster.
If a developer has to make one call to find the user ID associated with a particular email and then make another call to find the corresponding address, what is the individual waiting time? Simple optimization will take twice as long for the whole process. Call yourself instead of jumping straight from the developer's information to the information you need.
The agile User Experience Approach for building different UI/UX Processes. Click to explore about, Product Design, System and User Experience Solutions
Shorten the Data Responses
Compression might be the way to go if you wish to reduce latency without sacrificing data. In this case, you can use a gzip to compress the large response before posting it. Of course, this means that the developer must extract the client's response.
This makes the API faster in terms of latency, but the downside is the extra load on the server (for data compression) and extra load on the client (when fetching data). You have to decide for yourself for some people, especially those that provide large payloads (high-resolution images, audio files, video clips, etc.).
Keep up the Limited Resources.
API acceleration is a partial takeover of resources. For limited resources, the efficient way will be limited responses. In this case, the developer modifies the request with field parameters to only receive the requested data in a single request.
The size of resources will be limited by providing limited and fewer responses. This will allow faster execution with less data. As a complement, removing the unwanted data makes it easy for developers to analyze the API responses.

What is the Response Rate?
If the delay considers the network's latency itself, then the response time is the time it takes for the service to respond to the request. This can be more difficult to track with third-party APIs and web services, as sending and receiving data latency is part of the response time. Response times can be estimated by comparing response times between multiple resources for a particular API. You can now estimate the latency shared between API servers and determine the true value.
The response time has a direct impact on the application's performance. If the API response is delayed, user activity will be slow. You can work around this by ensuring that the API provider you choose has a guaranteed response time or by implementing a solution that uses fallback APIs or cached resources when a mutation is detected.
Application Automated Testing is a software practice that can be automated with the combination of different tools related to testing. Click to explore about, Web Application Automated Testing
Check the Response time of the API
You can use the test tool to measure response times by inserting critical business processes into the start and finish transactions. The response will vary slightly from tool to tool for the same response time measurement process for API.
-
Calculation of Metrics Collected by Each API
-
Response Time Test Tool Load Simulation and Conversion Rate Tools Can Make Differences in Response Time
-
Additional Factors Logged When Monitoring User Load
-
The computational metrics collected for each engine will increase response time due to their high resource consumption.
-
Two tools may have different architectures.
Different types of Response Metrics
|
APIs Average Response Time |
This time includes the loading time of Javascript files, XML, CSS, and others in the system. If any slow component is present in the system, it will affect the average response time. |
|
Peak Response Time |
This time is used to get the most dangerous components of a system. According to this, the time will be visible for the components not executed properly as expected. |
|
Error Rate |
It calculates the rate of all components that failed to execute or expired and also the HTTP requests that show an error. |
Available Key Response Time
|
0.1 Second |
This response time is much less than the user thinks there is no response time delay. |
|
1.0 Second |
There may be some lag, but the user will likely notice the interruption. Response times longer than 1 second can affect the user experience. |
|
10 Seconds |
If the user receives a response time of more than 6 seconds, he’ll either leave the page or reload it. This is the uppermost limit crossed for response time. |
What are the Tools used for Response Time testing?
Below are the most used tools for checking the response time of API prominently -
JMeter
It can be used for load and performance testing of target applications.
Load Runner
Microfocus developed Load Runner, a load-testing product. This tool works with a virtual user to test the system under test.
AEM
Referred to as AEM for short, Adobe Experience Manager is another effective tool for testing response times. You can run it for Queries, inappropriate responses, and more.

Our solutions cater to diverse industries, focusing on serving ever-changing marketing needs. Talk to our Product Design Expert
Best Practices for API's Response Time
Short response times or long wait times can degrade the user experience. Below are recommended best practices for acceptable response times and delays, all combined to provide a non-positive, if not acceptable, user experience.
-
Warnings are displayed in less than 10 seconds, Within 10-60 seconds.
-
As a general rule, the average alert delay should be stopped. The system operates correctly in 60 seconds, but an event delay of 60 to 90 seconds is acceptable
-
Up to 150 ms: best user experience
-
150 ms-300 ms: good/acceptable user experience
-
Over 300 ms: inadequate user experience
-
A long timeout slows performance but is not buggy and can slow down updates such as memory concentrators in large deployments and scaling configurations.
Conclusion of this Comparison
As described above, good software needs to handle API calls, which is a serious concern. One can improve the API performance of their software/products by considering the above-mentioned best practices and the mentioned key response time issues.
- Discover more about Software Testability and its Various Types
- Click to explore TestOps Best Practises and Working Architecture
- Read more about Software Testing Automation
More Ways to Explore Us
TestOps Best Practises and Working Architecture
DevTestOps Advantages and Best Practices
API Development Best Practices