.webp?width=1921&height=622&name=usecase-banner%20(1).webp)
What is Observability and Why Is It Critical for Modern Cloud-Native and AI Systems?
Observability is the modern approach to understanding the real-time health, performance, and behaviour of complex distributed systems. As enterprises adopt cloud-native architectures, microservices, AI agents, and high-velocity DevOps practices, traditional monitoring is no longer enough. Observability empowers engineering, SRE, platform, and operations teams to gain deep visibility into every component of the system by analysing logs, metrics, traces, events, and contextual metadata together. It helps teams diagnose failures faster, ensure reliability at scale, and maintain consistent performance across on-prem, cloud, and edge environments.
In the era of Agentic AI and autonomous infrastructure, observability plays a critical role in enabling intelligent decision-making and automated remediation. With platforms like Nexastack, organisations can integrate observability into their private cloud AI, sovereign AI environments, and agent-driven workloads, ensuring that every inference, workflow, or multi-agent action is tracked with full transparency and governance. This level of insight is crucial for industries such as manufacturing, robotics, where system reliability, compliance, and operational continuity are mission-critical.
Modern observability goes beyond dashboards—it provides actionable insights through correlation, anomaly detection, dependency mapping, and AI-powered root-cause analysis. It accelerates incident response, improves uptime, optimises performance, and supports high-scale automation. By embedding observability into the entire lifecycle—from development to production—enterprises can build a resilient, predictable, and self-healing digital ecosystem.
Ultimately, observability is the foundation for reliable engineering, scalable AI systems, and autonomous operations, enabling enterprises to move confidently from reactive monitoring to proactive, intelligent control.
Key Takeaways
- Observability = understanding system internals through logs, metrics, and traces — without code changes.
- Traditional monitoring reacts to known failures; observability explores unknown ones.
- The three pillars are Logging, Metrics, and Tracing — each serves a distinct diagnostic purpose.
- SRE teams use observability to define and enforce SLOs, reduce MTTR, and protect error budgets.
- In agentic AI and cloud-native systems, observability is the foundation for automated remediation and sovereign AI governance.
The global observability market was valued at USD 2.9 billion in 2025 and is projected to reach USD 6.93 billion by 2031, growing at a CAGR of 15.62%. (Source: Mordor Intelligence, 2025)
What is Observability in simple terms?
Observability is the ability to understand what is happening inside a system by analysing its outputs like logs, metrics, and traces.
Why is Observability Important in Modern Enterprise Infrastructure?
Observability is a way to get insights into the whole infrastructure. It is essential for the operations team. It means assembling all fragments from logs and monitoring tools and organising them in such a way that gives actionable knowledge of the whole environment, thus creating insight. It is a combination of multiple items to create a deep understanding of the actual health, real issues, and what should be done to improve the environment and troubleshoot at a root level.
A tool that enables end users, administrators and organizations to gauge and evaluate the performance of a given system. Click to explore about, Performance Monitoring Tools.
This means the service can explain any questions about what is happening inside the system just by observing the outside of the system without entering new code to answer further questions. Software is enhancing exponentially extra complexity. It is a term from the control method. It is a test of how well the inner states of a system can be assumed by knowledge of its external outputs. The Observability and controllability of a system are numerical duals. It might mean various points to various characters. For unusual, it's about logs, metrics, and traces. To others, it's the first wine of monitoring in a fresh container.
-
Creating and operating an extra-visible system
-
A system that can explain itself without the need to deploy new code
-
Understanding connections between parts of your background or System
-
No complex system is always healthy
-
Categorised systems are pathologically unpredictable
Observability platforms enable organisations to monitor the overall health of their dynamic system. By utilising system performance metrics and user experience data, teams can ensure systems are continuously optimised. Self-regulating systems and metrics workflows are integral to maintaining performance standards, allowing teams to focus on critical debugging tasks. These systems can provide critical debugging data and system performance debugging without manual intervention, ensuring a faster response to emerging issues.
According to the 2024 Grafana Labs Observability Survey, 79% of organisations with centralised observability reported measurable time or cost savings — with reduced MTTR cited as the most common outcome.
What does it mean for a system to be observable?
It means you can understand its internal state using logs, metrics, and traces without modifying code.
Monitoring vs Observability: What Is the Difference?
|
Aspect |
Monitoring |
Observability |
|
Approach |
Pre-configured dashboards to alert on expected performance issues. |
Instrumented environments provide complete data for flexible exploration. |
|
Assumption |
Assumes the ability to predict potential problems. |
Enables discovery of unexpected issues by exploring data and tracing root causes. |
|
Environment |
Works well for static, predictable environments. |
Best suited for dynamic and complex cloud-native environments. |
|
Data Focus |
Relies primarily on predefined metrics and alerts. |
Expands beyond logs, metrics, and traces to include metadata, user behaviour, and network mapping. |
|
Scope |
Limited to predefined scenarios and performance expectations. |
Covers a broader scope with access to code-level details and system context. |
A Platform for Monitoring, Logging, Tracing and Visualization of Big Data Cluster and Kubernetes with ML and Deep learning. Click to explore, Observability for Kubernetes
Why is Observability Important for SRE and Enterprise Reliability?
In enterprise environments, observability helps cross-functional teams understand and answer specific questions about what’s happening in highly distributed systems. Observability lets you understand what is slow or broken and what you must do to improve performance. With an observability solution, teams can receive alerts about issues and proactively resolve them before they impact users.
Site Reliability Engineering Approach
Site reliability engineering (SRE) is Google's way of service management, where software engineers work on production systems using a software engineering approach. It's explicit that Google is different, and they usually need to catch software bugs and errors in various non-conventional ways.
-
Site Reliability Engineering for reliable operating systems and infrastructure scale.
-
Define metrics that matter most to the business, such as typical values for those metrics, and plan a reaction if the value isn't met.
-
Service level indicator, service level objectives, service level agreement
-
RED: The acronym stands for Rate, Errors, and Duration. These are request-scoped, not resource-scoped, as the USE method is. Duration is explicitly taken to mean distributions, not averages.
-
The increase means time to failure (MTTF), and the decrease means time to repair (MTTR)
Service level objective (SLO)
There is usually difficulty in using Service Level Agreement (SLA) and Service Level Objective (SLO). Certain SLOs (Service Level Objectives) are usually meant to define the precise, measurable targets that a service must meet to satisfy the expectations outlined in the SLA (Service Level Agreement). These objectives provide specific criteria for evaluating service performance, such as availability, throughput, repetition, response time, or quality. By establishing clear SLOs, organizations can effectively measure and manage service levels, ensuring that they adhere to agreed-upon standards and maintain a high level of service quality. The service demanded by the provider and the client varies depending on the service's needs, resources, and budget.
-
NO SLO < Good SLO < Perfect SLO
-
Pick an objective and iterate
-
Capture a set of events and use a window and target percentage of 99.9% of good events in the last 30 days.
-
A good SLO is barely user-happy.
-
Determine an error budget that allows failure in the tradeoff to prevent progress and innovation.
What Are the Three Pillars of Observability?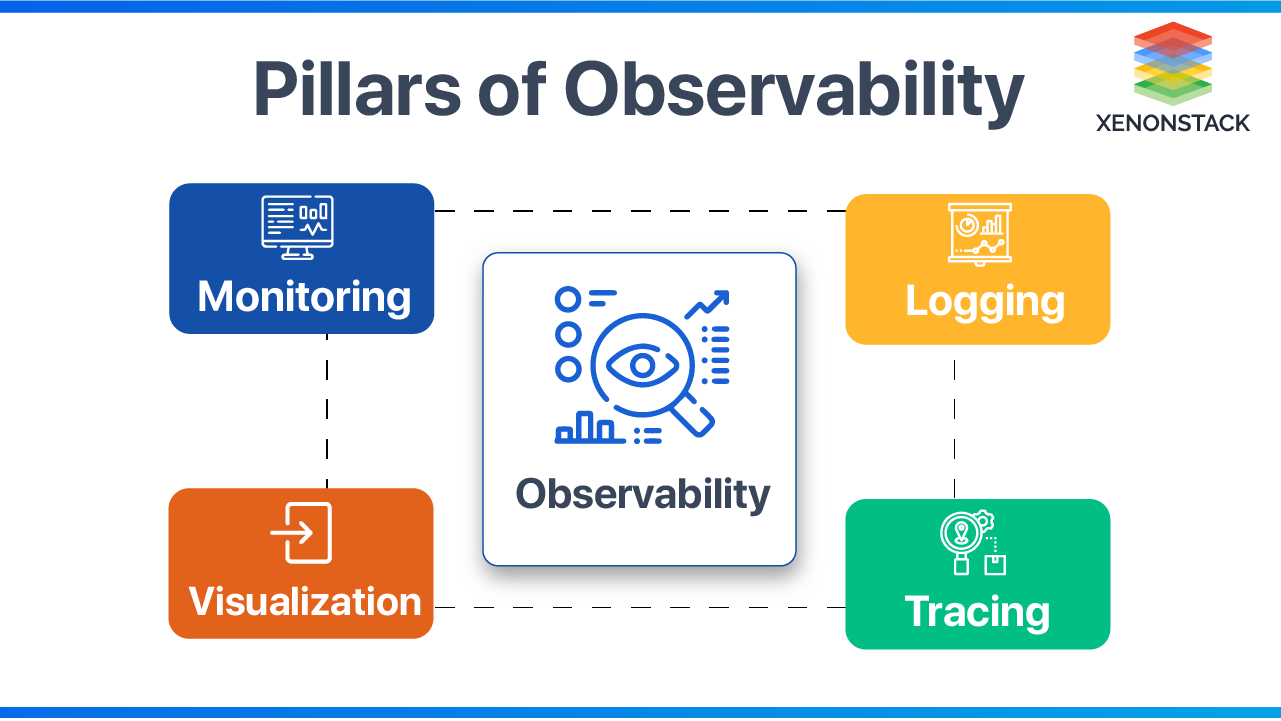
Observability in software systems is typically defined by three main pillars: Logging, Metrics, and Tracing. Each plays a crucial role in understanding system behaviour, diagnosing issues, and ensuring performance.
1. Logging — The Event Record
Logs capture discrete events within a system: errors, state changes, warnings, and informational messages, each timestamped and contextualised.
Types:
- Plain logs — free-form text; easy to generate, harder to parse at scale.
- Structured logs — JSON or key-value formatted; machine-readable and query-friendly.
Best practices:
- Standardise log output using logging libraries.
- Aggregate centrally (e.g., Elasticsearch) for long-term retention.
- Disable debug mode in production — it inflates volume, increases cost, and generates false-positive alerts.
- Visualise with tools like Kibana for operational queries.
2. Metrics — The Performance Signal
Metrics are numerical, time-series representations of system behaviour — response times, error rates, CPU utilisation, request throughput.
-
Why they matter: Metrics are aggregated over time to detect trends, set baselines, and trigger alerts. They are the primary input for SLO tracking and capacity planning.
-
Implementation: Most runtime environments support metric collection natively. Push data to endpoints (e.g., Prometheus) for aggregation and alerting.
3. Tracing — The Request Journey
Distributed tracing captures the end-to-end path of a request as it travels across services, databases, and external APIs.
Key properties:
- Each trace carries a global correlation ID propagated across all service boundaries.
- Tools like Jaeger and Zipkin visualise the full request flow.
- OpenTelemetry provides a vendor-neutral standard for trace instrumentation across languages and platforms.
OpenTelemetry is now the second most active CNCF project after Kubernetes. As of 2024, 85% of surveyed organisations had adopted OpenTelemetry or OpenTelemetry-centric tooling as part of their observability strategy. (Grafana Labs Observability Survey, 2024)
Diagnostic value: Tracing pinpoints exactly where latency is introduced or where failures cascade, enabling precise root-cause analysis in multi-service architectures.
A non-functional type of testing that measures the performance of an application or software under a certain workload. Click to explore, Performance Testing Tools
How Does Observability Work in Practice?
To attain the ultimate state of observability, consider the following -Logging Process
Logging is a mechanism to collect logs from various input sources. Usually, logs are in raw format. To gain real insights, parse these logs and apply queries to gain insights quickly. Usually, logs are sent to an output tool that organises the logs. Logging defines what to log, how it should be logged, and how logs are shipped to an external system for aggregation.
Debug mode is disabled for better logging, as logging everything based on a debug level will become expensive to manage, creating extra false positives, not-so-important alarms, and more difficulty in getting important data. Debug should be the default only while troubleshooting, not in real production environments
Monitoring Process
Monitoring is an activity performed by DevOps guys. It’s simply observing the state of an infrastructure/environment over a period of time. Monitor for three reasons:
-
Detecting Problems— usually by alerts or looking at issues on dashboards
-
Finding Resolution for Problem— finding root causes of issues and troubleshooting
-
Continuous Improvement— reporting and documenting
Tracing Working
Trace the calls between various applications. Priorities are defined as different service failures, and the one with the highest priority is caught and alerted immediately. Tracing shows what either happened in the past or what is happening at present. Tracing is a very important piece of it proactively. It also suggests what code we can add to the service to provide better insights into the application. There should be transparent visibility end-to-end for all transactions happening in the environment.
How Alerting Works?
Alerting helps define how to notify the Ops guys when an event occurs. It is very important to remove false positives. There should be -
-
Alert only to important events
-
Self-healing infrastructure
-
Enable analytics when something has been done manually many times
-
Enable Automation to fix the problems
Monitoring of applications is the biggest aspect, As the speed and the accuracy expected is very high to address the issue on time. Click to explore about, Application Performance Management in DevOps

Why Is Observability Critical for SRE and Enterprise Reliability?
Site Reliability Engineering (SRE) formalises the relationship between observability data and service reliability commitments through a structured framework:
Key SRE constructs:
- SLI (Service Level Indicator): The measured signal — e.g., request latency, error rate.
- SLO (Service Level Objective): The target — e.g., 99.9% of requests complete within 200ms over 30 days.
- SLA (Service Level Agreement): The contractual commitment derived from SLOs.
- Error Budget: The allowable failure margin within an SLO period — consumed by incidents, deployments, and experiments.
RED Method (request-scoped metrics):
- Rate — requests per second
- Errors — failed request ratio
- Duration — latency distribution (not averages)
Operational targets:
- Increase MTTF (Mean Time to Failure) — build more resilient systems.
- Decrease MTTR (Mean Time to Repair) — resolve incidents faster with better data.
A well-defined SLO answers the question: "What does 'good enough' look like for this service, and how do we measure it objectively?"
As per the 2024 DORA report (39,000+ respondents): Elite-performing teams recover from failures in under one hour and deploy multiple times daily, compared to low performers who can take over a week to recover. Elite teams recover 2,293x faster than low-performing teams.
What Are The Benefits of Observability?
Observability provides significant benefits for IT teams, organizations, and end users. Key use cases include:
Application Performance Monitoring: Accelerates issue resolution in cloud-native and microservices environments, improving efficiency and innovation.
DevSecOps and SRE: Observability is embedded in application design, helping teams build secure, resilient applications during the software delivery lifecycle.
Infrastructure, Cloud, and Kubernetes Monitoring: Enhances monitoring of on-premises, cloud, and Kubernetes environments, improving uptime, performance, and issue resolution.
End-User Experience: Improves customer satisfaction by identifying and addressing issues before users notice, optimizing the user experience with real-time feedback.
Business Analytics: Combines application performance with business context to optimize conversion, ensure software meets business goals, and meet SLAs.
DevOps Automation: Streamlines testing and CI/CD processes, enabling faster, higher-quality code releases, and improving team collaboration.
Microservices and serverless architectures generate 50–100x more telemetry than monolithic systems, making unified observability essential — not optional — for cloud-native environments. (CNCF / Mordor Intelligence, 2025)
What Are the Best Practices of Observability?
Logging is a mechanism for collecting logs from various input sources. Usually, logs are in raw format. To gain real insights, parse these logs and apply queries to gain insights quicker. Usually, logs are sent to an output tool that organizes them. Logging defines what to log, how it should be logged, and how logs are shipped to an external system for aggregating.
Debug mode is disabled for better logging as logging everything based on a debug level will become expensive to manage, creating extra false positives, not-so-important alarms, and more difficulty in getting important data. Debug should be the default only while troubleshooting, not in real production environments
Following Best Practices while allowing Observability for applications running in the environment -
-
Do not Monitor everything.
-
Monitor only things that are essential to fix when they fail.
-
Do not put Alerts on everything.
-
Put alerting only for critical events.
-
Do not store all logs and all data.
-
Store only logs that give insights about critical events.
-
Don't use default graphs.
-
Create a custom graph according to customer needs.
-
Create alerts based on Prometheus or Grafana metrics of running applications in an environment.
What Are the Top Observability Tools?
List of Top Observability Tools
- Logging
- Fluentd
- Logstash
- Prometheus
- Grafana
- Containers and Orchestration tools such as Docker and Kubernetes.
- Log Aggregator
- AWS Cloudwatch
- Slack
- Pagerduty
Conclusion: Why Observability Is the Foundation of Reliable Engineering
Observability is not a monitoring upgrade — it is an architectural capability. It transforms how engineering and operations teams interact with complex systems by replacing reactive alerting with proactive, data-driven intelligence.
For enterprises running cloud-native workloads, Kubernetes environments, or agentic AI systems, observability provides:
- Faster root-cause analysis through correlated logs, metrics, and traces
- Proactive reliability through SLO tracking and error budget management
- Governance and auditability for AI workloads and autonomous operations
- Self-healing potential through alert-driven automation and anomaly detection
The organisations that embed observability into every layer — from development pipelines to production AI agents — are the ones that move from reactive firefighting to predictable, resilient operations.