Key takeaway
- How time series databases fit real-time analytics: when to choose one over a relational database, options, cardinality, retention and governance.
What is a time series database and when do you need one?
A time series database stores and queries records that arrive with a timestamp and are read mostly by time range: server metrics, sensor readings, trades, clickstream events and application telemetry. Its job is fast ingest of a steady stream, efficient time-range queries and aggregation over windows, which is why it sits behind monitoring, IoT and real-time dashboards. In the Prometheus data model, for example, all data is stored as streams of timestamped values that belong to the same metric and a set of labels.
You need one when the main questions are "what happened between these two times" and "how is this changing now". If the main questions are about entities and their relationships, a relational database is usually the better fit. This guide explains the choice, the architecture around it and the controls an enterprise should add. For the wider pipeline, see our real-time analytics tools and real-time analytics architecture guides.
How does a time series database differ from a relational one?
Both can store timestamped rows. The difference is what each is built to optimise. Several modern time series systems are not a separate world from SQL: the hypertable documentation describes a hypertable as a PostgreSQL table that automatically partitions time-series data by time into chunks, so a query touches only the relevant time range. The InfluxDB 3 Core documentation describes InfluxDB 3 Core as storing event and time series data, with SQL and InfluxQL query languages and Parquet files as its storage format.
| Question | Time series database | Relational database |
|---|---|---|
| Typical access pattern | Append new points, read by time range and window | Read and update rows by key, join across entities |
| Data shape | Timestamp, value or values, and identifying tags or labels | Many entities with relationships and constraints |
| Scaling pressure | Steady growth in volume as time passes | Growth in entities and relationships |
| Where it fits | Metrics, sensors, telemetry, market ticks | Orders, customers, accounts, master data |
| Watch for | Number of distinct series (see cardinality below) | Large tables scanned across time without partitioning |
Neither is universally better. The two often run together: a relational system holds the master data and a time series store holds the measurements that refer to it.
How do you choose a time series database?
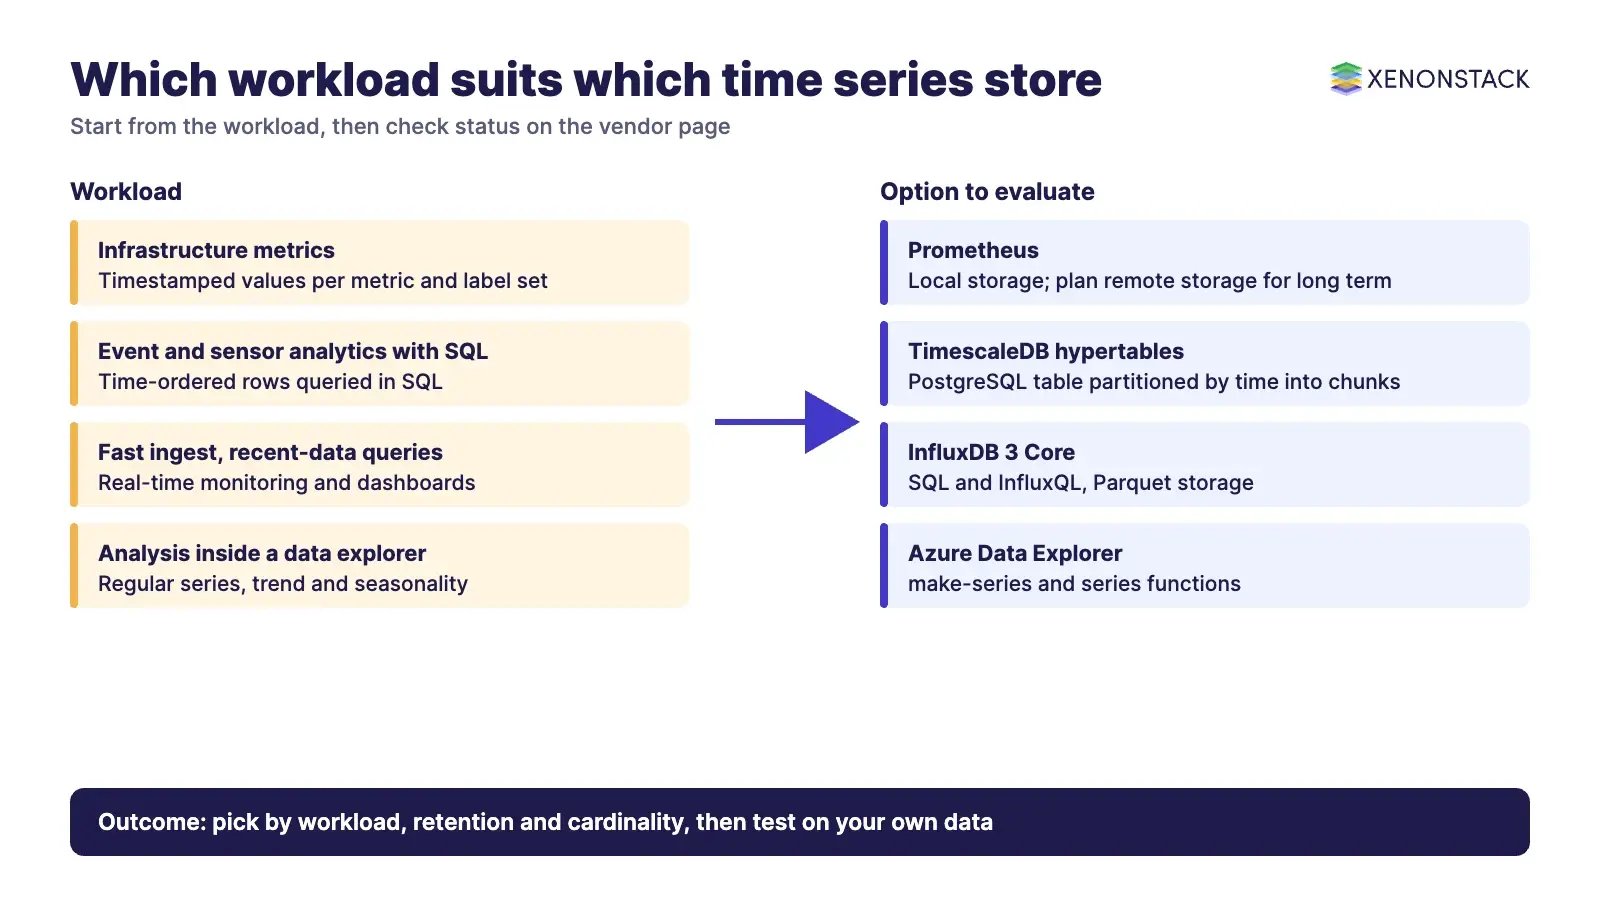
Start from the workload, then check status and operating model on the vendor's own page. The table lists four well-documented options and what each page says about itself.
| Workload | Option | What its documentation says | Trade-off to check |
|---|---|---|---|
| Infrastructure and application metrics | Prometheus | Stores timestamped values per metric and label set; local storage retention defaults to 15 days | Local storage is not clustered or replicated; plan remote storage for long-term data |
| Event and sensor analytics with SQL | TimescaleDB hypertables | A PostgreSQL table that partitions time-series data by time into chunks | Product and hosting names change, confirm on the official page |
| Real-time ingest with fast queries on recent data | InfluxDB 3 Core | Open source; SQL and InfluxQL; data stored as Parquet; designed for real-time monitoring | Core retention is set when a database is created and cannot be changed |
| Time series analysis inside a data explorer | Azure Data Explorer | make-series builds regular series; series functions cover trend and seasonality | Confirm current features on Microsoft Learn |
These are examples, not a ranking. Sources: Prometheus storage documentation, hypertable documentation, InfluxDB 3 Core documentation and Azure Data Explorer time series documentation. Confirm versions and licences on each official page before you commit.
How does real-time analytics work on top of a time series database?
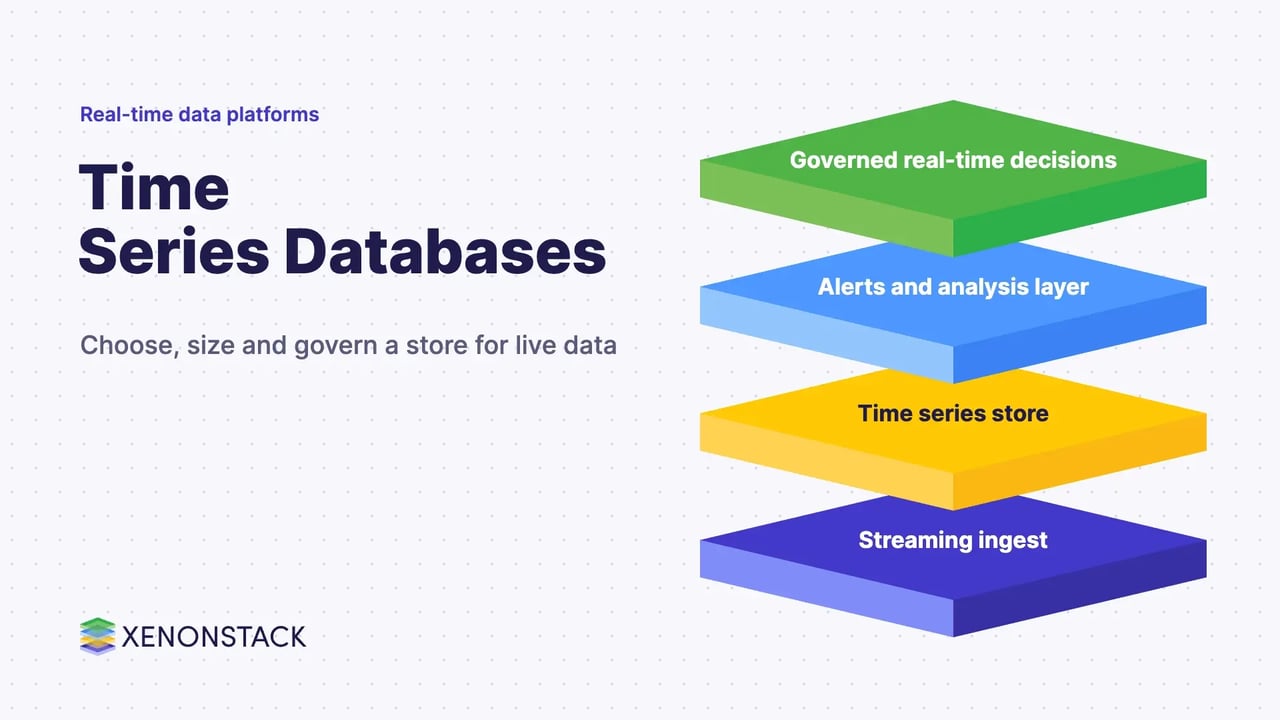
The database is one layer. A typical flow is: producers emit events, a streaming layer buffers and transforms them, the time series store holds recent and historical points, and a query or visualisation layer serves dashboards, alerts and models. Our guides on stream processing and real-time streaming with Spark and Kafka cover the streaming layer, and streaming data visualisation covers the last mile.
Real-time here means the answer arrives while it can still change a decision. Define that as a number, for example the maximum seconds between an event and its appearance on the dashboard, and test it. A store that ingests quickly but is queried through a slow path does not give real-time analytics.
What does the analysis layer do with the data?
Time series stores support windowed aggregates, trend detection and anomaly flags. The Azure Data Explorer time series documentation shows the pattern: build regular series from raw telemetry, fit a line for the trend, detect seasonal periods and look for anomalies in the residual after a moving average is subtracted. For forecasting and model choice, see time series analysis and models and time series deep learning.
What goes wrong with time series data at scale?
| Problem | Why it happens | Control |
|---|---|---|
| Series explosion | In Prometheus, changing any label value, or adding or removing a label, creates a new time series | Agree label standards and avoid labels with unbounded values such as user IDs |
| Data lost or capped early | Local storage retention defaults to 15 days in Prometheus; InfluxDB 3 Core retention is fixed at database creation | Set retention per data class and decide the long-term store before launch |
| Single point of failure | Prometheus local storage is not clustered or replicated, per its documentation | Use remote write to a durable store and test restore |
| Slow dashboards | Queries scan wide time ranges | Use time partitioning, pre-aggregated rollups and sensible default ranges |
| Untrusted numbers | Late, duplicate or out-of-order events change totals | Define event-time rules, deduplication and a data quality check at ingest |
How should an enterprise govern time series data?
Time series data feeds alerts, automated actions and increasingly AI agents, so it needs the same discipline as any decision input. Record who owns each metric, what it means, its retention and where it is allowed to flow. When an agent acts on a signal, keep the decision trace: the data window it read, the policy it applied and who approved the action. ElixirData Context OS keeps governed context, versioned policy and decision traces in one decision layer above AI agents. For questions over enterprise data in plain language, AgentAnalyst lets teams ask questions of enterprise data in plain language and get real-time insights. See also our agentic workflows guide.
What is a sensible adoption sequence?
| Step | What to do | Done when |
|---|---|---|
| 1. Pick one workload | Choose one stream, such as service metrics or one sensor class | A named owner and a business question exist |
| 2. Set the latency target | Write the maximum event-to-dashboard delay | The target is measured, not assumed |
| 3. Choose and size the store | Compare options against the table above using vendor pages | Retention, backup and restore are tested |
| 4. Control cardinality | Set label and tag standards | Series count is monitored |
| 5. Add alerts and actions | Connect thresholds or models to alerts, then to governed actions | Every automated action has an owner and a trace |
| 6. Review cost and value | Review storage, query and egress cost against decisions improved | Keep, tier or retire each stream |
When is a time series database the wrong choice?
Do not add one for a few thousand rows that a relational table handles well. Do not use it as the system of record for entities with many relationships. Do not choose by benchmark claims alone: ask for your own data, your own queries and your own retention rules in a trial. If your streams are low volume and your questions are about entities, keep the relational database and add time partitioning when it hurts.
To map one real-time decision your agents should make, and the context and policy it depends on, book a Context Workshop. See what happens in the workshop.
Frequently asked questions
What is a time series database?
A time series database stores timestamped records and is built for fast ingest and time-range queries. Prometheus, for example, stores data as streams of timestamped values belonging to the same metric and label set.
How is a time series database different from a relational database?
It optimises for append-heavy, time-ordered data read by range and window, while a relational database optimises for entities, keys and joins. Some systems, such as hypertables on PostgreSQL, combine time partitioning with SQL.
Is a time series database the same as real-time analytics?
No. The database is one layer. Real-time analytics also needs streaming ingest, a query or visualisation layer and a measured latency target.
What is cardinality and why does it matter?
Cardinality is the number of distinct series. In Prometheus, any change of a label value creates a new series, so unbounded labels can multiply the series count and the cost.
How long should we keep time series data?
Set retention by data class. Prometheus local storage defaults to 15 days, and InfluxDB 3 Core retention is set when the database is created, so decide the long-term store before launch and confirm on the official page.
Ready to put AI agents to work? See an ElixirClaw demo: the agentic OS to build, orchestrate and govern AI agents across your enterprise systems.
Explore the XenonStack platform family: ElixirData · ElixirClaw · ElixirHub · NexaStack · MetaSecure · Neural AI · AgentGRC · AgentSRE · AgentAnalyst · AgentInstruct · AgentRAI · AgentScrum · AgentSearch · AgentForce · AI Aviator · SAIF Aviator · CohortIQ · XenonStack AI · XenonStack UAE