
.webp?width=1921&height=622&name=usecase-banner%20(1).webp)
What is Google Lighthouse?
Google Lighthouse is an open-source tool provided by google developers so that anyone can check their web page metrics and score of it. After knowing its score, we can optimize our web page and improve our score according to metrics.
History of Lighthouse
Google developers created this tool as famous websites were lacking in performance, and there was no single measuring tool for it. So they created Google Lighthouse and automated tools as well for performance, accessibility, and SEO. This helped the worldwide developers to improve their web pages accordingly.
How Google Lighthouse Works?
Lighthouse optimizes each segment of a page like DOM Hierarchy, Hierarchy of each tag of HTML 5, Unused CSS and JavaScript, Color Combinations Ratio, the Loading time of third-party Js and Css, External Libraries and many more aspects. Accordingly, we will find a metrics score like this :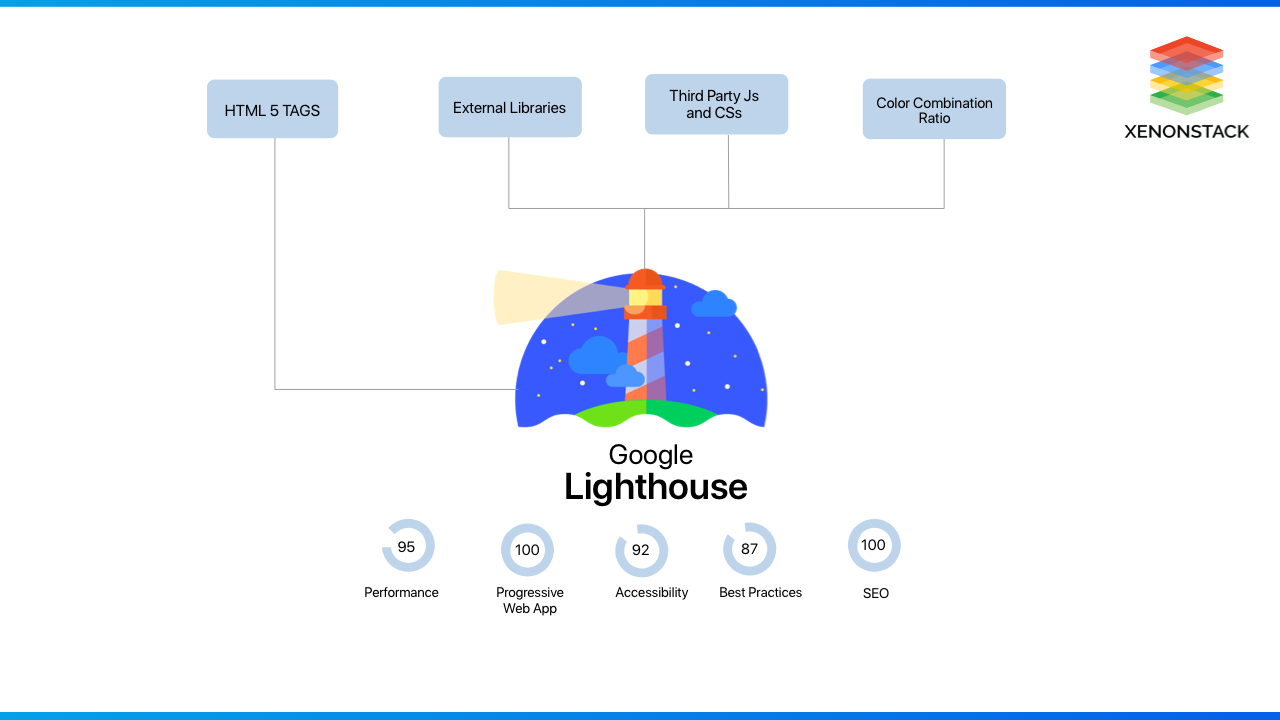
Where you can access Google Lighthouse?
In inspecting element, you will find the Lighthouse tab, and if it is not available, download the Lighthouse extension from
And install it and now run the audit from the lighthouse and you can also edit Url and check the Metrics of your webpage.
The challenge we face in the technologically advanced world is to make the computer understand the language or logic as much as the human does. Semantic Search Engine with Ontology and ML
How to Get Started with Google Lighthouse?
Below are the details to get started with Google Lighthouse.
Initialization of Lighthouse
Pick the Lighthouse work process that suits you best:
- In Chrome DevTools. Effectively review pages that require verification and read your reports in an easy-to-use design.
- From the order line. Mechanizing your Lighthouse runs through shell scripts.
- As a Node module, incorporate Lighthouse into your constant coordination frameworks.
- From a web UI, Run Lighthouse and connect to reports without introducing a thing.
- In Chrome Dev Tools, you have to follow these basic steps.
- Download Google Chrome
- Go to the URL you want to audit
- You Can audit any URL on the web
- Open Google Dev Tools
- Select LightHouse and Click on Run Audit (Generate Report)
- Wait for 30-60 Seconds
- Here you go, you will get an optimized report for your webpage.
Visual Representation of How to Run an Audit on Lighthouse ( Google Chrome)
Open Google Chrome and go to any URL you want. In this situation, I am using www.xenonstack.com.
Now open Google Dev Tool, and for opening it, you can do two things
Right-click on the page and select Inspect Option
Use Ctrl + Shift + I or F12 for Windows/Linux and Command + Shift + I for Mac
Now after opening Google Dev Tool Section, Select Lighthouse and Click on Audit (Generate Report). After Clicking the Generate Report, you will get the Output Like this
Now, the final Output
- From an Order (Command) Line
- Install Node Module
- Download Google Chrome
- Install Lighthouse. The -Gflag installs it as a global module.
- To run an audit:
- LightHouse as a chrome extension
- Install an extension
- Run audit
Focusing on page speed is paramount to having a successful company and a website that converts. Score a Perfect 100% on Google PageSpeed
Website Audits with Lighthouse
Performance Audits
It measures the performance of the webpage and finds out the best opportunities to increase the performance of the webpage.
Lighthouse Performance Scoring
Its shows the metrics according to the performance of the page, and it is due to some reasons like :
- An advertisement which is running on the website
- Third-Party Applications
- Internet Connectivity Routing Changes
- Vary according to the devices like High-End Device V/S Low-End Device
- Antivirus Installed in System
- Firewall Securities
NOTE: High the metrics score lower the page loading speed and vice versa
You can refer to the lighthouse scoring calculator and find out the best metrics by shifting the scale manually to work on your page performance.
How Metrics Score is Determined?
The metrics are scored in Ms (MilliSecond) and ranges between 0-100. It gathers every data of the webpage and generates the score accordingly.
For example, (LCP) Largest Content Paint is around 1200ms. It will give your Performance Score around 99, and it is the minimum time taken.
LCP: Largest Contentful Paint (LCP) measures when a client sees that the biggest substance is noticeable. The measurement incentive for LCP addresses the time term between the client starting the page load and the page delivering its essential substance.
Google Lighthouse Scoring Curve Model
Lighthouse Scoring Curve takes the HTTP archive data to make the curve between two median points, and it takes the 25th percentile of the first and second data to compare and create a curve between them. If we go deeper into the concepts of the curves, you should know the median and some statistical terms and formulas.
Statistical Concept
The 25th percentile of HTTPArchive information turns into a score of 50 (the middle control point), and the eighth percentile turns into a score of 90 (the great/green control point). While investigating the scoring bend plot underneath, note that somewhere in the range of 0.50 and 0.92, there's a close direct connection between metric worth and score. Approx a score of 0.96 is the "purpose in unavoidable losses" as above it, the bend pulls away, requiring progressively more metric improvement to work on a generally high score.
User Experience Design focuses on the user-first way of designing products/services and their requirements and how much satisfactory the product for the users who are going to use it. User Experience Design, Tools and Principles
Desktop vs. Mobile Handling
As we know, all the scores and curves are made from the real-time statistical data of the webpage, and mainly desktop scores are converted to mobile scores so that they can vary.
If the desktop score is 6, then the mobile score will be five, and Vice Versa can also happen. Here 5 and 6 are the ratios. For example, if we have 60% performance in Desktop and 50% performance in mobile devices. So it will be called 6 and 5.
Now the question arises why the scores of mobile and desktop are different, so here is the answer below:
Mobile PageSpeed scores are different from desktop PageSpeed scores mainly because of these factors:
- In Mobile Devices generally, we are having Slower Processor than Desktops
- Mobile Devices are having Slower Cellular Network as Compared to Desktops
- Mobile devices have device-specific CSS rules (resizing images, viewport size, etc.)
Score Colors and their Meaning
To provide a friendly user experience, sites should strive to have a great score (90-100). A "perfect" score of 100 is highly challenging to achieve and not expected. For example, a score from 99 to 100 needs about the same amount of metric enhancement that would take a 90 to 94.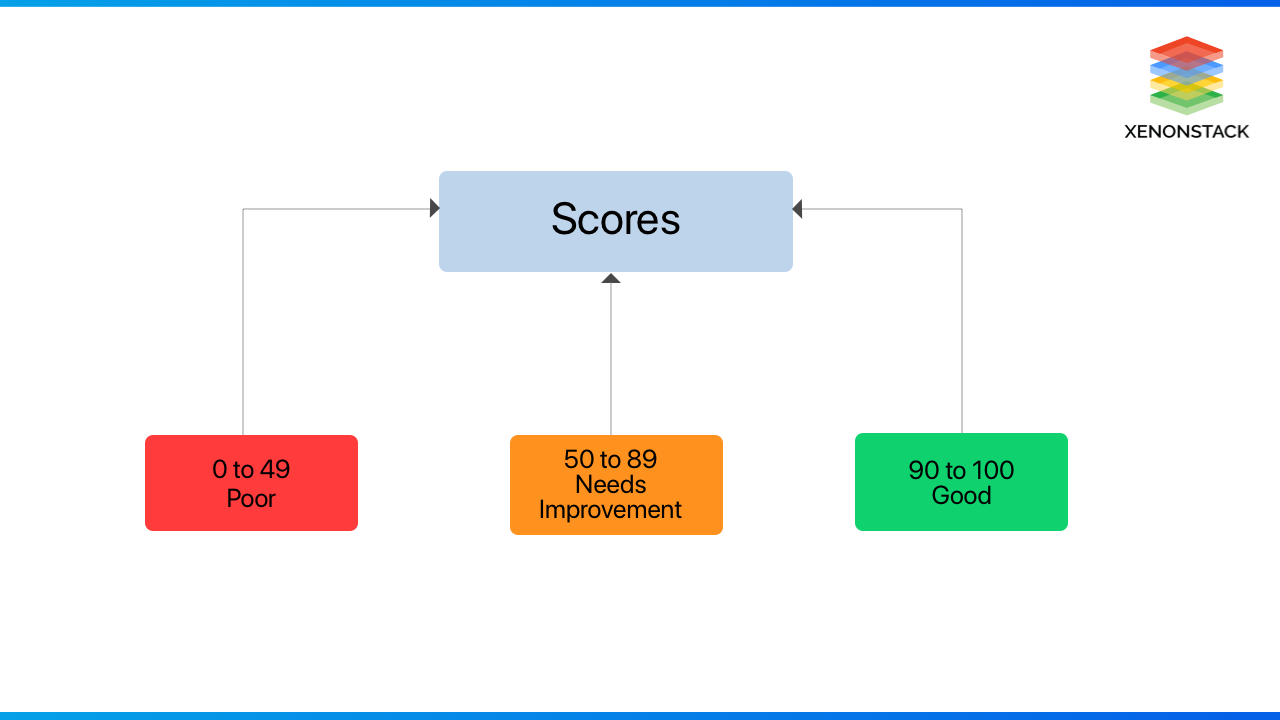
What are the 7 Important Metrics for Performance Audits ?
Inversions 6 and 7, Lighthouse's performance score consisted of seven metrics, each contributing a percentage of the total performance score.
Total Blocking Time (TBT)
| Metric Name | Weight |
| Largest Contentful Paint (LCP) | 25% |
| Total Blocking Time (TBT) | 25% |
| First Contentful Paint (FCP) | 15% |
| Speed Index (SI) | 15% |
| Time to Interactive(TTI) | 15% |
| Cumulative Layout Shift (CLS) | 5% |
Largest Contentful Paint (LCP)
It represents the user perception of the loading experience, and it has the weightage of 25%, and it measures the point where the largest image or element occurs with respect to all viewports.
The best time for achieving LCP is <2.5 Seconds.
| LCP time (in milisecond) | Color-Coding |
| 0 - 2,500 | Green (Fast) |
| 2,501 - 4,000 | Orange (Moderate) |
| Over 4,000 | Red ( Slow) |
What are the elements which are part of the LCP
→ Text
→ Images
→ Videos
→ Background Images
Now the question arises what the reason for poor LCP is. Here is the answer
1. Slow Server Response time
Solution:
- Optimize your server / Use nearby CDN
- Establish Third-Party Connections Early
2. Render Blocking JavaScript & CSS
Solution:
- Minify CSS and JS
- Remove Unused CSS and JS
- Remove Inline CSS
3. Resource Load Time
Solution:
- Compress Image Size ad Video Size
- Preload Important Resources Early.
4. Client-Side Rendering
Solution:
- Minimize Critical JavaScript
Total Blocking Time (TBT)
Interactive. TBT measures the time between First Contentful Paint and Time to Interactive. It represents the responsiveness to user input, and its weightage in performance is 25%. It is the lab equivalent of First Input Delay (FID) – the field data used in the Chrome User Experience (UX) Report and Google's upcoming Page Experience ranking signal.
The best time for TBT should be less than 300 Milliseconds.
| TBT time (in millisecond) | Color-Coding |
| 0 - 300 | Green (Fast) |
| 301 - 600 | Orange (Moderate) |
| Over 600 | Red ( Slow) |
How to fix Poor TBT?
- Break Up Long Tasks
- Optimize your page for readiness Interactions
- Use a web worker
- Reduce JavaScript Execution Time
First Contentful Paint (FCP)
The word itself says First Contentful Paint (FCP) which represents the time measured when the first image or text is visible, and its weightage to performance is 15%.
The best time for FCP is less than 2seconds.
| FCP time (in seconds) | Color-Coding | FCP Score (HTTPS Archive percentile) |
| 0 - 2 | Green (Fast) | 75 - 100 |
| 2 - 4 | Orange (Moderate) | 50 - 74 |
| 4 | Red ( Slow) | 0 - 49 |
Speed Index (SI)
It represents how much time is visible during load, and its weightage is 15% and the best time for SI is less than 4.2 seconds.
| SI time (in seconds) | Color-Coding | FCP Score (HTTP Archive percentile) |
| 0 - 4.3 | Green (Fast) | 75 - 100 |
| 4.4 - 5.8 | Orange (Moderate) | 50 - 74 |
| 5.8+ | Red ( Slow) | 0 - 49 |
Time to Interactive(TTI)
It represents the Load responsiveness; identifying where a page looks responsive but isn't yet and its weightage is 15%, and the best time is less than 3.8seconds
| TTI Score (in seconds) | Color-Coding |
| 0 - 3.8 | Green (Fast) |
| 3.8 - 7.3 | Orange (Moderate) |
| 7.3+ | Red (Poor) |
Cumulative Layout Shift (CLS)
CLS represents a user's perception of a page's visual stability, and its weightage is just 5% and the best time for it is less than 0.1 seconds.Red
| CLS Score | Color-Coding |
| 0 - 0.01 | Green (Good) |
| 0.1 - 0.25 | Orange (needs improvment) |
| 0.25+ | Red (poor) |
PWA AUDITS
PWA Audits measure if your site is fast, reliable, and installable.
- Page Load fast and reliable on mobile networks or not?
- Page Responding or not?
- The page has HTTPS or not?
- Does Page have meta tags?
The answer to all questions is in PWA Audits.
PWA: Progressive Web Apps
Most cellular network operators use the internet at a very low speed compared to broadband/ Wireless networks. So performance can vary up to thrice if the speed is slow. So we have to optimize the webpage and use the tools and attributes which HTML 5 and Js provide. Like lazy load, async and defer, etc.
So if you want to raise your performance and speed, you can go to the opportunities section, and it will provide you the exact information about everything you need to know, and then you can apply and increase your performance
Best Practice Audits
It is the doctor of your page's health with the best remedy. It includes:
- General Best Practices
- Make your page Fast and Secure
- Good User Experience
- Avoids Unused API's
- General Best Practices
It will tell you that your page is missing doctype, the page has console errors, and ell you the deferred image sizes with improper aspect ratios.
- Make your page fast and secure.
Use HTTPS 2, Don't use cross-origin, Use parse listeners, Use document. write
where they are used.
- Good User Experience
Use on load functions to load js and CSS to increase the user experience.
Access all the Best Practices for Audits.
Accessibility Audits
These checks highlighted opportunities to improve the accessibility of your web app. Only a subset of accessibility issues can be automatically detected, so manual testing is also encouraged.
In this accessibility check, many terms and conditions create opportunities for increased accessibility.
For example, if you are using code like this: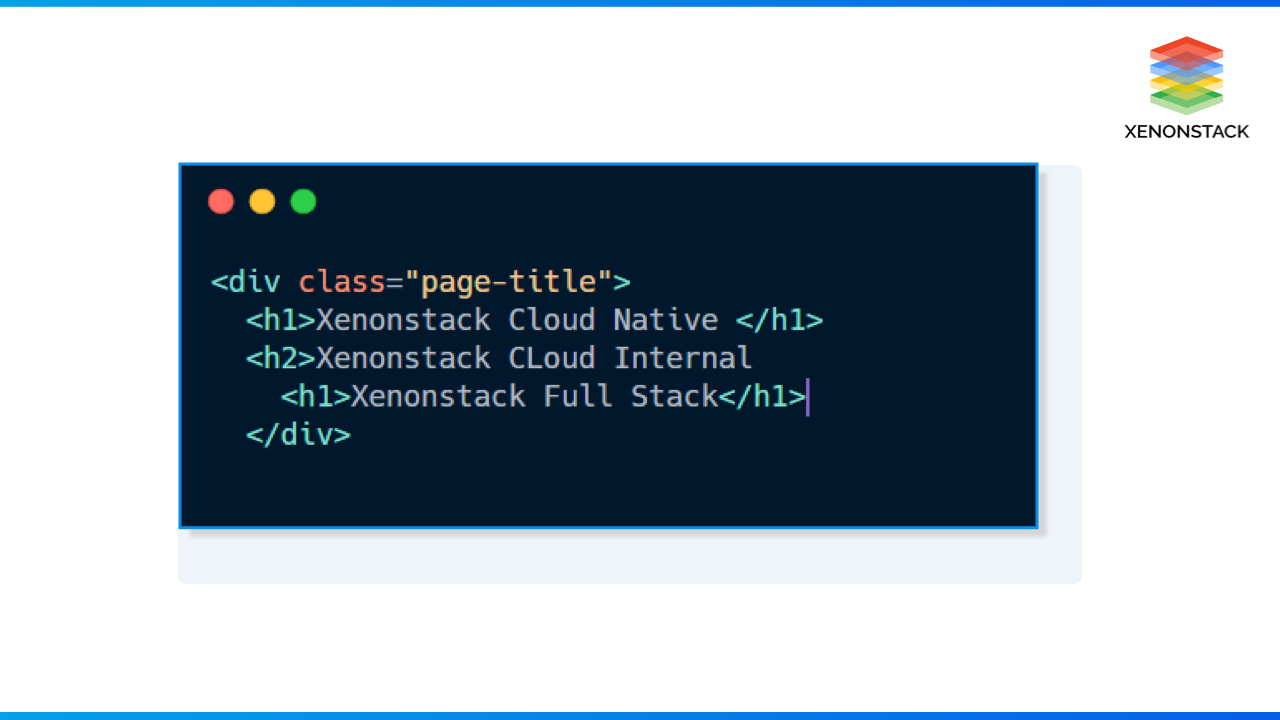
So it will tell you that you have used improper hierarchy according to accessibility. So we will improve and change the hierarchy to improve accessibility.
If we don't use alt tag in Image, it will also highlight that you haven't used alt tag. If you leave a blank anchor tag, it will say that anchor tags are not crawlable, and many more accessibility checks are there.
What is SEO Audits?
The full form of SEO is Search Engine Optimization. These checks ensure that your page is optimized for search engine results ranking.
SEO Audits will tell us that your page does not have a title, the meta description is missing, Links are not proper, Links do not have descriptive tags, and many more things.
What are the benefit of SEO Audit?
If we use an SEO audit, it will help us improve our SEO and rank on google. If we rank on google, the business will get more and more clients and business. Always remember, "We all know who lands on the moon first time , but we don't remember the name of the second person who landed on the moon," So it is crystal clear what is the importance of SEO audit.
What are the Pros and Cons of Lighthouse?
| Pros | Cons |
| Easy to Install and Use | Needs Some knowledge to use is appropriately |
| Helps us to improve Performance , SEO and Accessibility of web page | It is possible to get a 100% accessibility rating on Lighthouse and still have a site which is largely not accessible. |


