
.webp?width=1921&height=622&name=usecase-banner%20(1).webp)
Introduction to Tableau
Tableau Data Visualization is an apparatus generally utilized for Business Intelligence; however, it is not constrained. It makes common diagrams and graphs as dashboards and worksheets to pick up business experiences. Data Visualization with Tableau Software is an item association headquartered in Seattle, Washington, that produces instinctive data discernment things focused on business understanding, and the entirety of this is made conceivable with motions as straightforward as drag and drop!Points to consider before using Tableau Data Visualization
- You don't have to realize a lot for Data Visualization With Tableau. Yet, at the same time, a fundamental familiarity with all sorts of diagrams, for example, bar charts, line outlines, histograms, etc., are loved.
- It would also be valuable if you had some essential comprehension of the database of the executives (data types, joins, drill down, drill up, etc.).
Tableau has been considered as one of the leaders in Data Visualization as it provides the best cloud-based analytics solution along with all the BI capabilities your business need. Source: Best Analytics Tools For Data Visualization
What are the 5 main products offered by Tableau?
the 5 main products provided by Tableau are listed below:
- Tableau Desktop
- Tableau Reader
- Tableau Server
- Tableau Public
- Tableau Online
Every offer Data Visual Creation and choice depends on the sort. 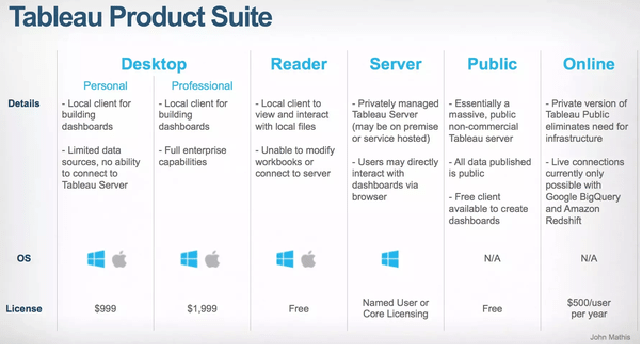
Installation of Tableau
Besides these products, Tableau Desktop, Public, and Online offer Data Visual Creation.Tableau Desktop
It is accessible in the coming three configurations:- Free access for 14 days
- You get free access to the Desktop for a full year if you are a student or a teacher.
- Buy Tableau
Tableau Public
Tableau Public is free from all expenses and doesn't require any license for Data Visualization using Tableau. In any case, it accompanies a restriction that your information and exercise manuals are made open to all Tableau clients.Tableau Online
Tableau Online is the best alternative for you if you wish to make your Workbooks on the Cloud and have the option to access them from wherever.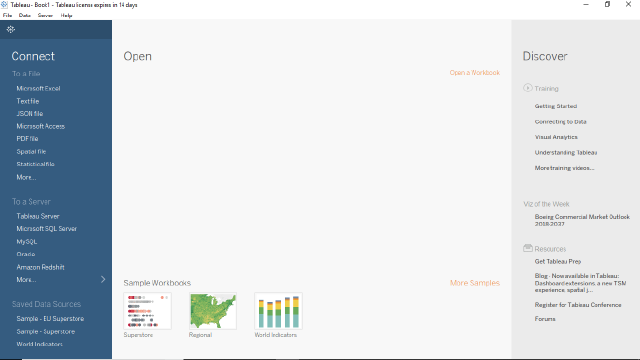
Getting Started with Tableau Data Visualisation
Steps to get started with Tableau for Data Visualisation are described below:
Tableau Workspace
- The Tableau workspace consists of worksheets, a menu bar, a toolbar, a marks card, shelves, and many other components, which we will learn about in future segments.
- Sheets can be worksheets, dashboards, or stories. The picture underneath features significant parts of the workspace.
- A more significant commonality will be accomplished once we work with accurate information.
Connecting to a Data Source
- To start data visualisation with Tableau, we must interface Tableau with the information source. The scene is good, with a ton of information sources.
- The information sources upheld by Tableau Data Visualisation appear on the left half of the initial screen. Some commonly utilised information sources are excellent text files, relational databases, or servers.
- Likewise, one can interface with a cloud database source, such as Google Analytics or Amazon Redshift.
- The dispatch screen of Tableau Desktop shows the accessible information sources that one can associate with as well. Data Visualisation in Tableau is likewise subject to the form of Tableau since the paid adaptation offers more possibilities.
- On the left side of the screen, you will see a Connect sheet featuring accessible sources. Document types are recorded first, followed by basic server types or the servers that have been associated recently.
- You can open recently made exercise manuals Under the Open tab. Tableau Desktop additionally gives some example exercise manuals under Sample Workbooks.
We will be working with an example informational index named Supermarket dataset, where the information is that of a Supermarket dataset. It contains data about products, sales, profits, etc. As Data Analysts, we aim to dissect the report and find basic demanding progress inside this imaginary organization.
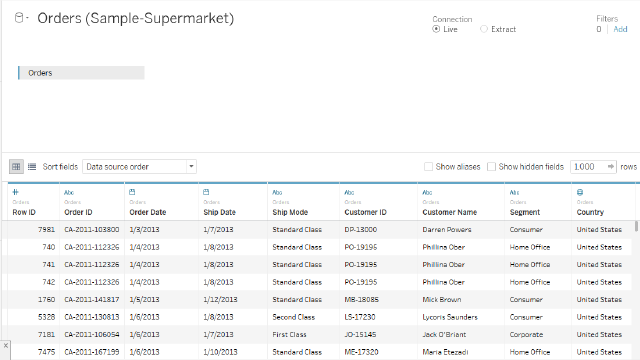
Steps
- Import the Data into the scene workspace from the PC.
- Three sheets will become apparent within the Sheets Tab, especially Orders, People, and Returns. We will concentrate just on Orders information. Double-tap on the Orders Sheet, and it opens up only like a spreadsheet.
- We watch the first three columns of information look somewhat changed and aren't in the ideal arrangement. Tableau Data Visualization we utilize Data Interpreter, likewise present under the Sheets Tab. By tapping on it, we get a pleasantly designed sheet.
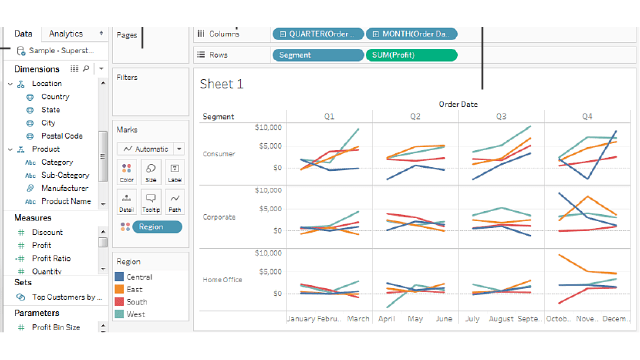
Creating a View
We will begin by creating a straightforward diagram. Right now, we will find useful pace information and start to inquire about the data to gain bits of knowledge. There are some crucial terms that we will experience right now.- Dimension
- Measures
- Aggregation
Dimension
- They are personal information, such as a name or date. Of course, data visualization with Tableau consequently characterises information that contains subjective or precise cut data as a dimension, such as any field with content or date values.
- These fields, generally, appear as section headers for columns of information, such as Customer Name or Order Date, and characterise the degree of granularity that appears in the view.
Measures
- Measures are quantitative numerical information. Of course, Tableau treats any field containing this sort of data, such as deals, exchanges, or benefits, as a measure.
- Information named a measure can be collected depending on a given measurement, such as all-out deals (Measure) by area (Dimension).
Aggregation
- The column-level information moved up to a higher classification, for example, the aggregate sum of sales or total profit.
Steps
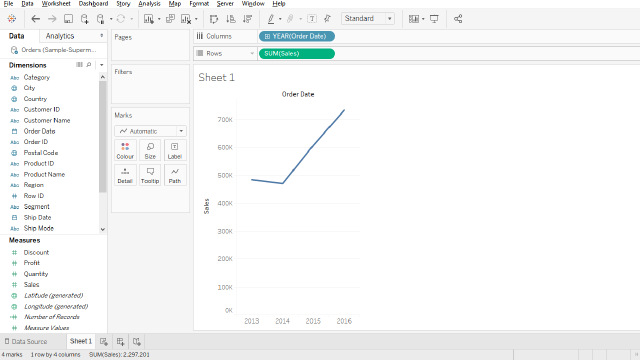
- Go to the worksheet. Snap on the tab Sheet 1 at the base left of the scene workspace.
- Under Dimensions at the bottom of the distribution datasheet, drag the order date to the column shelf. Dragging the Order Date to the sections shelf makes a segment for Orders in the dataset. An 'Abc' marker is visible under every section, which implies that content or numerical or content information can be dragged here. Then again, if we pulled Sales here, a cross-tab would be made to show the total sales for every year.
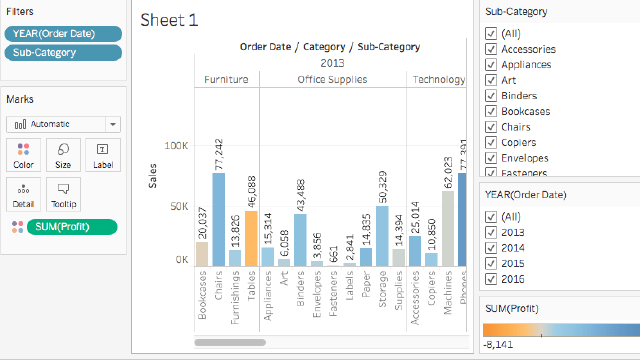
- Likewise, drag the Sales field onto the Rows shelf from the Measures tab. Data Visualisation in Tableau populates a graph with deals totalled as a total. Total aggregated sales for every year by request date are shown. Scene consistently fills a line diagram for a view incorporating time-field, which is now Order Date.
Refining the View
Let us dive further into Tableau Data Visualization and attempt to discover more experiences concerning which items drive more deals. We should begin by adding the item classes to see deal sums alternately.Steps
- The category is available under the Dimensions sheet. Drag it to the section's shelf and spot it alongside YEAR(Order Date). The Category ought to be set to one side of the Year. In doing as such, the view promptly changes to a bar graph type from a line. The graph shows the general Sales for each Product by year.
For Data Visualization using Tableau, about every data point (mark) in the view, float more than one of the bars to uncover a tooltip. The tooltip shows all our deals for that class. Here are some tips for office supplies for 2016. To add a name to the view, click Show tag labels in the tag. 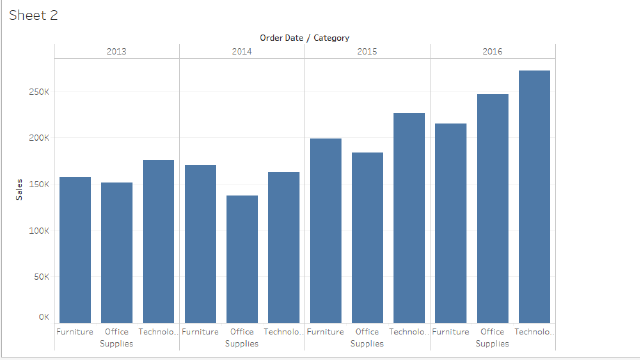 The bar diagram can be shown on a level plane rather than vertically as well—Snap Swap on the toolbar for the equivalent.
 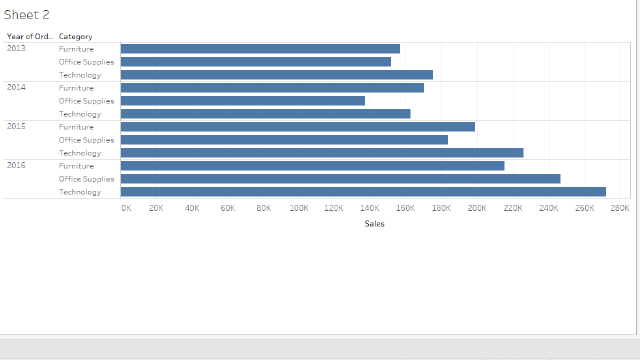 The view above pleasantly shows sales by category, i.e., furniture, office supplies, and innovation. We can likewise deduce that furniture deals are becoming quicker than deals in office supplies aside from 2016. Therefore, focusing sales efforts on furniture instead of office supplies will be wise. In any case, furniture is a huge class and comprises a wide range of things. How might we recognize which furniture thing is contributing to the most excellent deals?
To assist us with addressing that question, we choose to see items by subcategory to see which things are the vast vendors. Suppose we need to look at insights concerning just bookcases, chairs, furnishings, and tables for the Furniture classification. We will Double-snap or drag the Sub-Category measurement to the Columns shelf to begin Data Visualisation with Tableau.
The sub-class is another discrete field. It further analyzes the Category and presents a bar for each sub-classification separated by class and year. However, it is a humongous measure of information to comprehend outwardly. In the following area, we will find out about channels, shading, and different approaches to make the view progressively comprehensible. 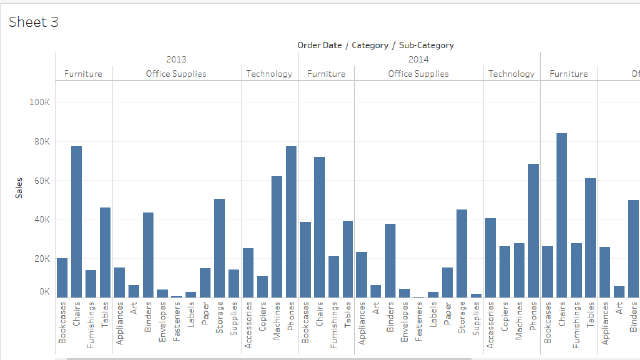
Emphasizing the Results
- In this section, we try to focus on individual results. Filters and bars are one way to pay more attention to the details that interest you.
Adding filters to the view
- Filters can be utilized to incorporate, or bar esteems in the view. Here we attempt to add two primary channels to the worksheet to simplify looking at product sales by sub-category for a particular year.
Steps
Under Dimensions, right-click Order Date in the Datasheet and select Show Filter. Repeat for the Sub > category field, moreover.Adding colors to the view
Colors can be useful in distinguishing visual proof of an example.Steps
On the Data tab, on the Steps and calculations tab, drag Profit to the Results tab. Bookcases, tables, and machines may bring negative benefits. Lost. Emergency information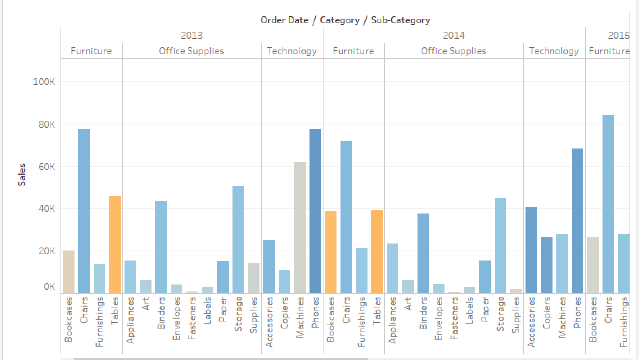
Key Findings
We should investigate the channels to discover increasingly about the unrewarding items.Steps
- In the view, uncheck all crates except Bookcases, Tables, and Machines in the Sub-Category channel card. This uncovers a curious truth. While bookcases and machines were productive in specific years, they became unrewarding in 2016.
- Select All in the Sub-Category channel card to show all subcategories again. Drag the area onto the row shelf during the test and place one side of the "Sales" tab. We notice that machines in the South announce a higher negative benefit overall than in your different areas.
- Let us currently give a name to the sheet at the base left of the workspace, double-tap Sheet 1, and type Sales by Product and Region.
- To save the view, Data Visualization in Tableau permits us to copy our worksheet to proceed to another sheet from the last known point of interest.
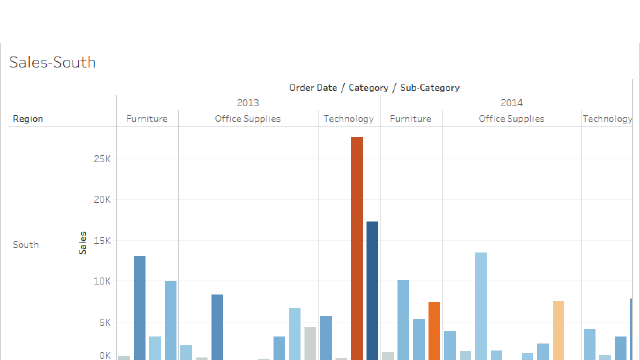
- In your exercise manual, right-click the Sales by Product and Region sheet, select Duplicate, and rename the copied layer to Sales-South.
- The new worksheet moves the dimensions into the filter compartment and adds them as channels on the screen.
- In the Filter Region exchange box, clear all checkboxes except South, and then click OK. Presently, we can concentrate on deals and benefits in the South. We find that machine deals had a negative benefit in 2014 and again in 2016. We will explore this in the following section.
- In conclusion, remember to spare the outcomes by choosing File > Save As. Let us name our exercise manual Regional Sales and Profits.

Creating a Map View
Maps are useful when we examine geographic information (the Region field). In the present model, Tableau consequently perceives that the Country, State, City, and Postal Code fields contain geological data.Steps
- Create a new worksheet.
- Include State and Country under Datasheet to Detail on the Marks card. We acquire the map view.
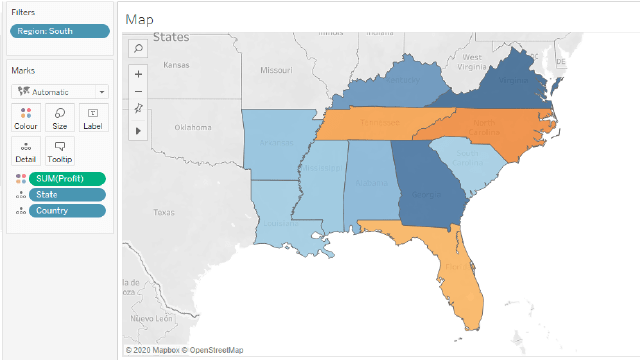
- Drag Region to the Filters shelf, and afterward channel down to South as it were. The guide sees currently zooms in toward the South locale, and an imprint speaks to each state.
- Drag the Sales measure to the Color tab on the Marks card. We acquire a filled guide with the hues indicating the scope of deals in each state.
- We can change the shading plan by clicking Color on the Marks card and choosing Edit Colors.
- We can try different things with available palettes.
- We see that Florida is playing out the best-concerning Sales. If we Hover over Florida, it shows a sum of 89,474 USD in deals when contrasted with South Carolina, which has just 8,482 USD in transactions. Let us measure the exhibition by Profit now since Profit is a superior marker to Sales alone.
- Drag Profit to Color on the Marks card. We currently observe that Tennessee, North Carolina, and Florida have negative benefits, even though it showed up they were doing acceptably in Sales. When you add a map to the sheet as Profit Map
Getting into the details
Maps in Tableau Data Visualization engage us to envision the information extensively. We found that Tennessee, North Carolina, and Florida have a negative benefit in the last advance. Right now, we attract a Bar outline to investigate the purpose behind the adverse interest.Steps
- Copy the Profit Map worksheet and name it the Negative Profit Bar Chart.
- Click Show Me on the Negative Profit Bar Chart worksheet. Show Me presents the number of manners by which a chart can be plotted between things referenced in the spreadsheet. I select the even bar alternative from Show and quickly update the view to level from vertical bars.
- We can choose more than each bar by mostly clicking and hauling the cursor over them. We need to concentrate just on the three states, i.e., Tennessee, North Carolina, and Florida. Henceforth, we will only choose the bars relating to them.
Creating Hierarchies
Hierarchies of importance prove to be useful when we need to aggregate comparable fields to penetrate down between Levels of knowing rapidly.- Layers in the video. Drag a field into the datasheet and drop it directly onto another area or right-click on the area and select it.
- Drag additional fields in the chain of importance. Fields can likewise be re-requested in the pecking order by basically dragging them to another position. In the current Data Visualization using Tableau, we will make the accompanying progressions: Location, Order, and Product.
 Click the in addition to a moulded symbol on the Rows Shelf to drill down to the City level. That is a great deal of information. We can utilise N-Filter to channel and uncover the most vulnerable entertainers. For that, drag City from the Datasheet to the Filters shelf. Snap By field, and afterwards, click the Top drop-down and choose Bottom to uncover the most fragile entertainers. Type 5 in the content box to show the last five entertainers in the informational collection.
During the Data Visualisation With Tableau, we observed that Jacksonville and Miami, Florida, Burlington, North Carolina, Knoxville and Memphis, Tennessee, are the most unfortunate performing urban communities regarding benefits. One other imprint in the view—Jacksonville, North Carolina—doesn't have a place here since it has productive deals. This implies there is an issue with the channel we applied. We will take the assistance of the Tableau Order of Operations.
- Right-click the inclusion set (country, state) on the filter shelf and select Add to context. We find that Concord(North Carolina) now shows up in see while Miami (Florida) has vanished. This bodes well at this point.
- In any case, Jacksonville (North Carolina) is as yet present, which is mistaken. In the Rows shelf, click the molded symbol on the City tab. It will penetrate down to the Postal Code level. Right-click, the postal code for Jacksonville, NC, 28540, and afterward, select Exclude to reject Jacksonville physically.
- Drag the Postal Code of the Rows shelf. This is the list view.
Key Findings
Steps
-
Drag Sub-Category to the Rows to additionally bore down.
-
Also, drag the Profit to Colour on the Marks card. This empowers us to spot items with negative benefits rapidly.
-
Right-click the Order Date and select Show Filter. It appears that Machines, tables, and covers are performing inadequately. So what would it be advisable for us to do? One arrangement is to stop the offer of these items in Jacksonville, Concord, Burlington, Knoxville, and Memphis. How about we check if our choice is correct?
-
Let us head back to the recently made Profit Map sheet tab.
-
Presently, click on the Sub-Category field to choose the Show Filter choice.
-
Drag Profit to Measurements to the Label Marks tab
-
Click the order date again and choose Show Filters. From the channel, let us clean up the things that we believe add to negative benefits. In this way, uncheck the containers before Binders, Machines, and Tables separately. Presently we are just left with the benefit of making substances. This shows that elements like Binders, machines, and tables were causing misfortunes in certain zones, and we were directly in our discoveries.
Dashboard
A dashboard is a collection of some points that allows you to consider grouping data together.Creating a Dashboard
- Drag Sales in the South onto the empty dashboard.
- Drag the profit overview into the dashboard and drop it in the "Sales" view in the "South" view. Both perspectives are visible twice. To have the option to introduce information in a way so others can comprehend it, we can mastermind the dashboard precisely as we would prefer.
- On the Sales, South worksheet in the dashboard see, click under the Region and tidy up the Show Header. Rehash a similar procedure for the various headers. This assists with underscoring just what is required and conceals away the not-all-that-important data.
- On the Profit Map, Hide the Title also and play out similar strides for the Sales South guide.
- We can see that the Sub-Category channel card and Year of Order Date have been rehashed on the right side. Let us dispose of the extra by necessarily crossing them out. At last, click on the Year of Order Date. A drop-down bolt shows up and chooses the choice of Single Value (Slider). Presently let the enchantment unfurl. Examination by picking several years on the slider and the Sales additionally shift appropriately.
- Drag the SUM(Profit) channel to the base of the dashboard beneath Sales in the South for a superior view
As we conclude Data Visualisation With Tableau, our concise examination of information representation, the field is rich in potential applications in various orders; simultaneously, we should know about its practical and ethical complexities.


