Key takeaway
- Five pillars of data observability: quality, lineage, monitoring, tracing and security. Compare models, pick what to check first and adopt in sequence.
The pillars of data observability are the groups of signals a team watches to know whether data can be trusted: in this guide, data quality, data lineage, data monitoring, data tracing and data security. Together they tell you whether data is correct, where it came from, whether the pipeline is healthy, what happened to a single record, and who can touch it. Each pillar answers a different question, so a pipeline that covers only one or two will still fail in ways nobody sees.
The pillars matter most in streaming and real-time analytics, where bad data reaches dashboards, models and agents within seconds. Other vendors define the pillars differently, so this guide also maps our five to the best-known alternative model and to the open standards (OpenTelemetry and OpenLineage) that your tools are likely to use. Read it with our guides to data observability and AI-driven data observability.
What are the five pillars of data observability?
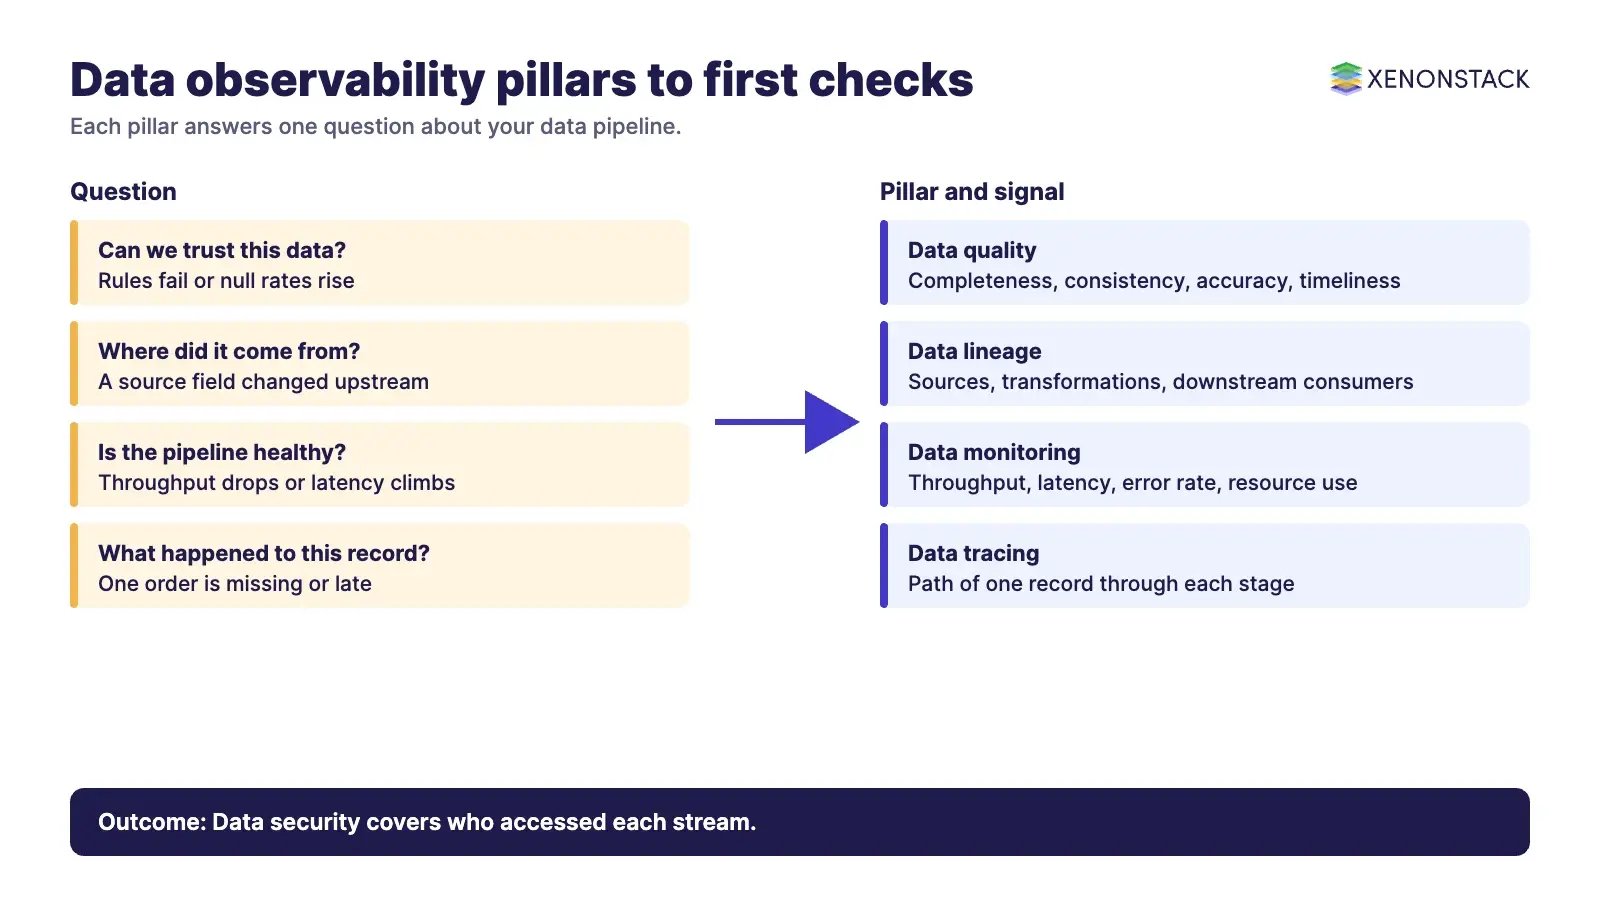
Data observability is the practice of monitoring, troubleshooting and improving the health of data as it moves through pipelines. The table below shows what each pillar answers and what a team watches.
| Pillar | Question it answers | What you watch | Typical first alert |
|---|---|---|---|
| Data quality | Can we trust this data? | Completeness, consistency, accuracy and timeliness rules | A rule fails or a null rate rises |
| Data lineage | Where did it come from and what depends on it? | Sources, transformations and downstream consumers | A schema change upstream |
| Data monitoring | Is the pipeline healthy right now? | Throughput, latency, error rate and resource use | Throughput drops or latency climbs |
| Data tracing | What happened to this record or batch? | The path of one record or batch through each stage | A record is missing or duplicated |
| Data security | Who accessed it and was it altered? | Access patterns, encryption state and security events | Unusual access to a sensitive stream |
Why do streaming pipelines need data observability?
Without visibility, data and analytics teams cannot see pipeline health or what happens between inputs and outputs. As teams grow and specialise, concurrent changes and miscommunication break pipelines more often, and engineers spend time chasing a dashboard that looks wrong instead of building. Streaming raises the stakes because the flow is continuous and high in volume, so a fault spreads before a batch-style check would run. Our guide to real-time analytics tools covers the consuming side; observability covers the health of what feeds it.
What does each pillar cover?
1. Data quality: can the data be trusted?
Data quality is the base of the other pillars. Four dimensions are used most often: completeness (no missing data), consistency (the same values across systems and over time), accuracy (correct and free from errors) and timeliness (processed and delivered within the time required). In streaming, quality checks work best as gates at ingestion, so bad records are quarantined before they reach models or reports. Our guides to data quality metrics and why data quality matters go deeper on measurement and business impact.
2. Data lineage: where did it come from and what breaks if it changes?
Data lineage maps how data moves from source to destination, including each transformation and aggregation. It lets a team trace a wrong number back to its origin and, in the other direction, see which reports and models a change will affect. It also supports audit, because you can show how a figure was produced. OpenLineage is an open framework for collecting lineage; according to its documentation it models datasets, jobs and runs, and it lists integrations with Apache Airflow, Apache Flink, Apache Spark, dbt, Great Expectations and Trino.
3. Data monitoring: is the pipeline healthy right now?
Monitoring watches the live state of streams: throughput, response time, failure ratio and resource use. A sudden surge, rising latency or a stalled consumer should alert the owning team with enough context to act. According to OpenTelemetry, metrics are aggregations over a period of time of numeric data about your infrastructure or application, and logs are timestamped messages emitted by services or other components. Both belong here. Pair them with data-level checks, because a healthy pipeline can still deliver bad data.
4. Data tracing: what happened to this record?
Lineage shows the general route; tracing follows individual records or batches through each stage, with timings and outcomes. OpenTelemetry describes a trace as the path of a request through your application, and the same idea applies when you attach an identifier to a record and follow it from ingestion to the sink. Tracing is the pillar to use when a specific customer, order or event is missing, duplicated or late, and aggregate monitoring looks normal.
5. Data security: who touched it and was it altered?
Streams often carry sensitive data, so observability must include security signals: encryption in transit and at rest, access controls, periodic review of access patterns, and alerts on unauthorised access attempts or possible leakage. See our guide to big data security for controls. For a wider frame, NIST Cybersecurity Framework 2.0 (released 26 February 2024) organises cyber risk into six functions: Govern, Identify, Protect, Detect, Respond and Recover. Security observability maps most directly to Detect, with the other functions depending on what it finds.
How do these pillars compare with other pillar models?
There is no single standard list. According to Monte Carlo, a data observability vendor, the five pillars are freshness, quality, volume, schema and lineage. That model describes the data tables; ours covers the data and the pipeline around it. Neither is wrong, so choose the one your tools report and fill the gaps.
| This guide | Closest in the Monte Carlo model | Related open standard |
|---|---|---|
| Data quality | Quality (null and unique percentages, accepted ranges) | Great Expectations is a listed OpenLineage integration |
| Data lineage | Lineage | OpenLineage (dataset, job, run) |
| Data monitoring | Freshness and volume | OpenTelemetry metrics and logs |
| Data tracing | No direct equivalent | OpenTelemetry traces |
| Data security | No direct equivalent | Outside the model; see NIST CSF 2.0 |
Schema change is not a separate pillar here. It shows up in lineage (what depends on the changed field) and in quality rules (a type or column check fails). Monte Carlo describes schema changes as often indicating broken data, so keep a schema check in whichever model you use.
Which pillar should you check first for a given failure?
| Symptom | Start with | Why |
|---|---|---|
| A dashboard number looks wrong | Data quality, then lineage | Confirm the rule that failed, then trace the upstream source |
| Data arrives late | Data monitoring | Latency and consumer lag point to the slow stage |
| One customer or order is missing | Data tracing | Aggregate metrics hide single-record loss |
| A source team changed a field | Data lineage | Shows every downstream report and model affected |
| Unexpected access to a sensitive stream | Data security | Access logs and alerts show who and when |
How should you adopt the pillars in sequence?
- Start with monitoring and quality on your most critical streams. Set threshold alerts on freshness, completeness, consistency and accuracy, and route them to a named owner with an escalation path.
- Add lineage next. Maintain a central metadata repository with schema versions, transformation logs and lineage, so changes are tracked automatically. Our open and unified metadata platform guide covers this layer.
- Standardise logging and alerting. Use structured logs for ingestion, transformation and usage, and define who is notified for each type of failure.
- Add tracing for high-value records. Carry an identifier through the pipeline for orders, payments or patient events where single-record loss is costly.
- Bring in anomaly detection. Use statistical or machine learning models to spot drift, missing values and format changes, and review alerts for noise before widening coverage.
- Put it in the delivery process. Tests, deployment gates and observability checks belong in the same pipeline; see Data DevOps.
Where do the pillars apply by industry?
| Industry | Example use | Pillars used most |
|---|---|---|
| Financial services | Detect drift and inconsistencies in transaction logs; automate checks on regulatory reports | Quality, lineage, security |
| Healthcare | Keep records consistent across providers; watch device data for faults | Quality, monitoring, security |
| Retail and e-commerce | Track stock levels across warehouses; catch pricing mismatches across platforms | Quality, monitoring |
| Energy | Check sensor accuracy for load management; monitor equipment health | Monitoring, quality |
| Manufacturing | Find inconsistencies in supplier records; watch machine performance | Quality, lineage, monitoring |
What changes when AI agents consume your data?
Agents act on data without a person reviewing each input, so a stale or wrong value becomes a wrong action, not just a wrong chart. That raises the value of lineage and quality signals: they become the evidence for why an agent acted. It also means observability needs to cover what the agent read and which policy applied. ElixirData Context OS keeps governed context, versioned policy and decision traces in one decision layer above AI agents, and AgentAnalyst lets teams ask questions of enterprise data in plain language and get real-time insights. For audit evidence, the Audit Agent assembles decision lineage, policy versions and approvals.
What are the trade-offs, and when should you not do everything at once?
- Alert fatigue: too many thresholds teach teams to ignore alerts. Start with a few critical streams and tune.
- Cost and overhead: record-level tracing and full lineage add storage and processing cost. Apply them where single-record accuracy or audit matters.
- Tool sprawl: separate tools for quality, lineage and security can leave gaps between them. Prefer open standards (OpenLineage, OpenTelemetry) so signals can be joined. Our cloud native observability tools and full-stack observability guides cover the infrastructure side.
- Ownership: an alert with no owner is noise. Name an owner for each pillar and each critical dataset before buying anything.
- Not every pipeline needs all five pillars: a nightly batch report with low business risk may need only quality checks and basic monitoring.
To map one data decision your agents should make, and the context and policy it depends on, book a Context Workshop. See what happens in the workshop.
Frequently asked questions
What are the five pillars of data observability?
In this guide they are data quality, data lineage, data monitoring, data tracing and data security. Monte Carlo, a vendor, uses a different list: freshness, quality, volume, schema and lineage.
What is the difference between data monitoring and data observability?
Monitoring watches known measures such as throughput and error rate and alerts on thresholds. Observability adds lineage, tracing and data-level checks so you can ask why something went wrong, including problems you did not predict.
What is the difference between data lineage and data tracing?
Lineage maps the route data takes between systems and the transformations along it. Tracing follows individual records or batches through each stage, which helps when one record is missing or late.
Which open standards support data observability?
OpenLineage is an open framework for lineage collection built around datasets, jobs and runs. OpenTelemetry defines logs, metrics and traces as signals for observability in general.
Where should a team start?
Start with quality checks and monitoring on the most business-critical streams, name an owner for each alert, then add lineage, tracing and anomaly detection in that order.
Follow XenonStack on LinkedIn: XenonStack on LinkedIn for new guides on agentic AI, data and platform engineering.
Ready to put AI agents to work? Explore ElixirClaw, the agentic OS platform to build, orchestrate and govern AI agents.
Explore the XenonStack platform family: ElixirData · ElixirClaw · ElixirHub · NexaStack · MetaSecure · Neural AI · AgentGRC · AgentSRE · AgentAnalyst · AgentInstruct · AgentRAI · AgentScrum · AgentSearch · AgentForce · AI Aviator · SAIF Aviator · CohortIQ · XenonStack AI · XenonStack UAE