Key takeaway
- UiPath Insights turns robot, process and queue data into dashboards and ROI views. See the default dashboards, how ROI is worked out and how agents fit in.
UiPath Insights is an analytics web application that models automation data and shows it as dashboards, so teams can track how robots, processes and queues perform and what the automation programme delivers. It answers a simple management question: what is our RPA actually doing, and is it worth it?
This guide is for automation owners, RPA centre of excellence leads and finance partners who want to measure UiPath automation. It covers what Insights is, the default dashboards, how the Business ROI view is calculated, and how to roll it out, and it ends with how AI agents change measurement. As the saying goes, what is well measured gets well managed, and good business intelligence and analytics start from the right questions.
What is UiPath Insights?
The About Insights page in the UiPath documentation calls Insights "a web application that serves as a platform for data modeling and analytics". It says Insights enables you to discover new analytical insights, track performance indicators, and be alerted of errors, and that dashboards can be copied, customised and downloaded. The documentation covers Insights for Automation Cloud, Automation Suite and standalone deployments, and each has its own versions, so read the guide that matches yours.
Insights matters to RPA programmes because return on investment is a central question in digital transformation. Leaders want numbers, and developers want error detail. One tool serves both.
How does UiPath Insights work?
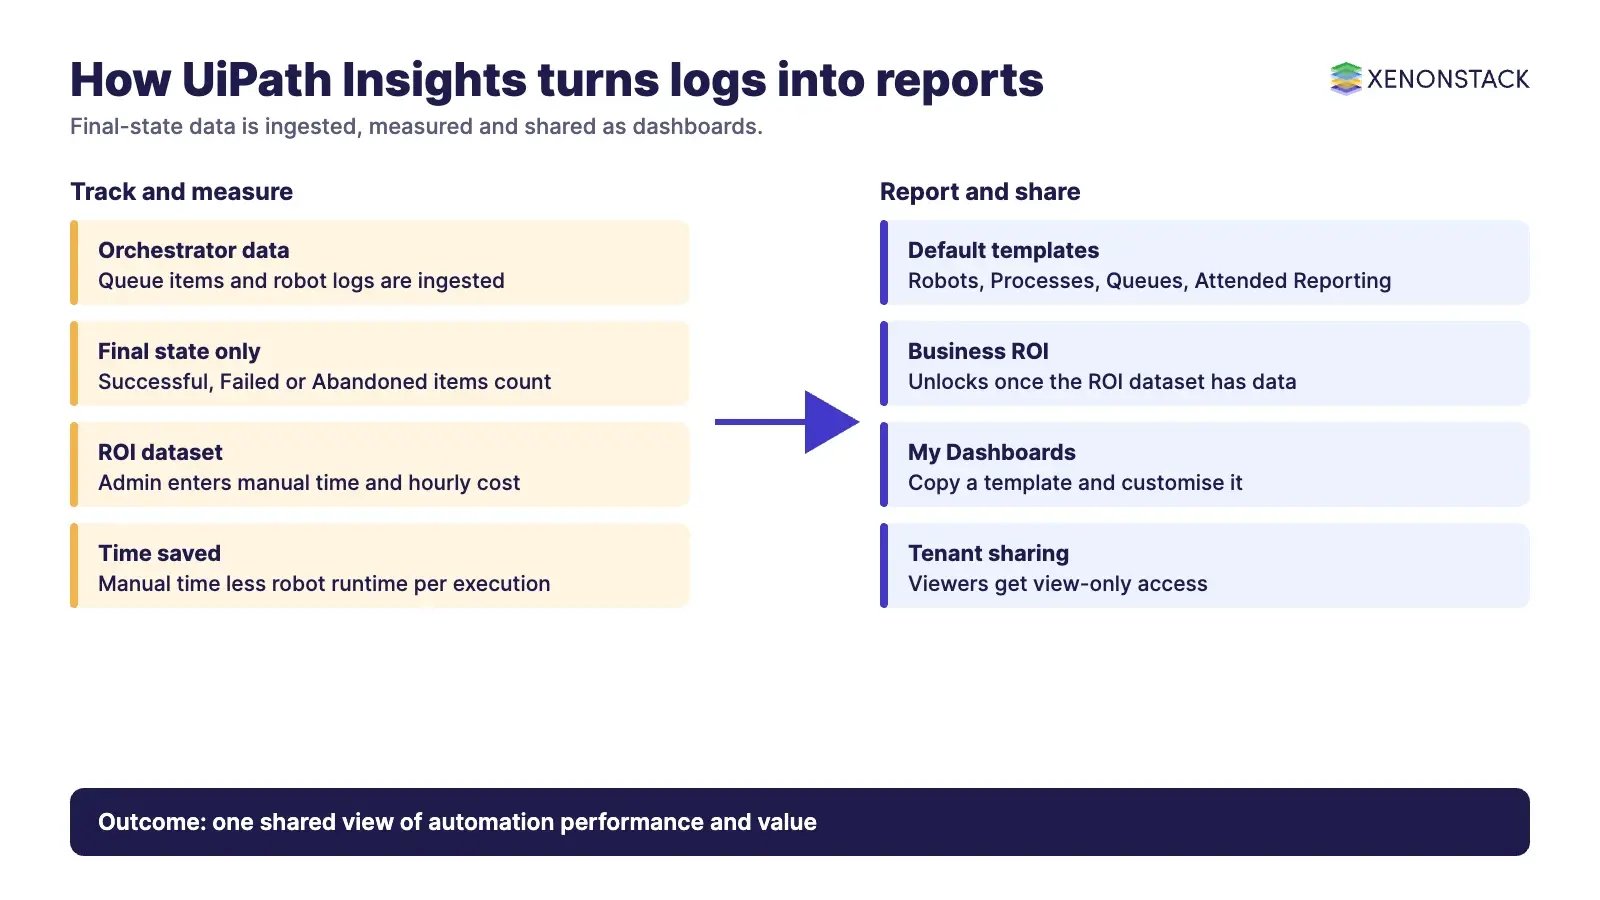
Insights follows three steps: track, measure and report.
- Track: it ingests data from Orchestrator and robot logs. The About Insights page says this happens about every 20 minutes and only for data in a final state, such as queue items marked Successful, Failed or Abandoned.
- Measure: it calculates figures such as success rates, run times and, for ROI, estimated time and money saved.
- Report: dashboards are shared with colleagues. The interacting with Insights page says the Tenant tab lets you share dashboards with everyone who has access to Insights on that tenant, with view-only access for viewers.
Because of the ingestion rule, a dashboard shows completed work, not what is running this minute. Use Orchestrator for live monitoring.
Which dashboards does UiPath Insights include?
According to the documentation, all users have access by default to the Robots and Machines, Processes, Queues and Attended Reporting templates. The Business ROI templates, including Business ROI Queues, stay locked unless an administrator has added data to the ROI dataset and the user has the right permissions. Older descriptions of Insights list four dashboards (Robots, Processes, Queues and Business ROI), so check the current set in the documentation for your version.
| Dashboard | Question it helps answer | Main audience |
|---|---|---|
| Robots and Machines | Are robots and machines productive, and where do they fail? | Developers and operations |
| Processes | How often do processes succeed, how long do they run, and what errors occur? | Developers and analysts |
| Queues | Which transactions fail or succeed, and which exceptions affect them? | Operations and process owners |
| Attended Reporting | How are attended automations being used? | Team leads |
| Business ROI | What time and money does automation save? | Leadership and finance |
For a first look at what each template shows, see the Insights templates page. Designers can copy a view-only template to My Dashboards and edit the copy.
How is Business ROI calculated?
The templates page says the Business ROI template estimates savings from values entered manually in the ROI dataset. Time saved is calculated as (Executions * Manual Time) - (Executions * Robot Runtime), and money saved is time saved multiplied by the hourly cost entered in the ROI dataset. The figures are only as good as those inputs, so agree the manual time and cost per process with the process owner and finance before you publish a number.
What is the difference between operational and business metrics?
| Type | Focus | Examples | Who uses it |
|---|---|---|---|
| Operational | How the automation runs | Success rate, run time, errors, queue exceptions | Analysts, developers, technical leads |
| Business | What the programme delivers | Time saved, money saved per process | Leadership and the RPA centre of excellence |
Keep both views. Operational metrics tell you what to fix, and business metrics tell you what to scale. Related reading includes our guides to RPA testing and the RPA testing framework, plus open source RPA tools.
How do you roll out UiPath Insights?
- Check the documentation for your deployment type and version, and confirm that Insights is available to you.
- Enable the service as the documentation describes and give users the right permissions.
- Have an administrator enter the ROI dataset values, so the Business ROI templates unlock.
- Copy the default templates to My Dashboards and tailor them for each audience.
- Share dashboards through the tenant and agree how often they are reviewed.
How do AI agents change automation analytics?
Dashboards describe what a bot did. Once AI agents choose actions, you also need to know why: which data was used, which policy applied and who approved. That is a different record from a run log, and it should sit beside your RPA metrics. ElixirClaw is XenonStack's AI agents computing platform. Treat agent outcomes as part of the same measurement framework as your robots, with the same questions about cost, error rate and ownership.
What should you do first?
- Choose three processes and agree the manual time and hourly cost for each.
- Enter them in the ROI dataset and unlock Business ROI.
- Review the Processes and Queues dashboards weekly for errors.
- Report one business number and one operational number to leadership.
- Decide how you will record agent decisions before you add them to the programme.
To map one decision your agents make beside your RPA reporting, and the data and policy it depends on, book a Context Workshop. See what happens in the workshop.
Frequently asked questions
What is UiPath Insights?
According to the UiPath documentation, it is a web application that serves as a platform for data modeling and analytics, used to track performance indicators and be alerted of errors.
Which dashboards are available by default?
All users have access to the Robots and Machines, Processes, Queues and Attended Reporting templates. The Business ROI templates stay locked until an administrator adds data to the ROI dataset.
How does UiPath Insights calculate time saved?
Time saved is executions multiplied by manual time, minus executions multiplied by robot runtime, using values entered in the ROI dataset.
How fresh is the data in Insights?
The documentation says data is ingested about every 20 minutes and only when it is in a final state, such as Successful, Failed or Abandoned.
Can I share Insights dashboards?
Yes. The Tenant tab lets you share dashboards with everyone who has access to Insights on the tenant, and viewers get view-only access.
Follow XenonStack on LinkedIn: XenonStack on LinkedIn for new guides on agentic AI, data and platform engineering.
Ready to put AI agents to work? Explore ElixirClaw, the agentic OS platform to build, orchestrate and govern AI agents.
Explore the XenonStack platform family: ElixirData · ElixirClaw · ElixirHub · NexaStack · MetaSecure · Neural AI · AgentGRC · AgentSRE · AgentAnalyst · AgentInstruct · AgentRAI · AgentScrum · AgentSearch · AgentForce · AI Aviator · SAIF Aviator · CohortIQ · XenonStack AI · XenonStack UAE