
.webp?width=1921&height=622&name=usecase-banner%20(1).webp)
Why is Explainable AI in Diabetes necessary?
AI in Healthcare is an industry that always makes it necessary to make a precise decision, whether it is a treatment, test, or discharge. Diabetes is common due to modern food intake, and it is necessary to keep track of the body. AI in Diabetes helps to predict or Detect Diabetes. Any neglect in health can have a high cost for the patients and the medical practitioner. It becomes challenging for the patient to trust that this decision is taken by the machine that does not explain how it reaches a particular conclusion.
So the use of the Explainable AI is mandatory in predicting disease that will help gain the confidence of an AI system result. Explainable AI helps to get the fair and correct output without errors.
Generative AI has many potential uses in healthcare, including drug discovery, disease diagnosis, patient care, medical imaging, and medical research. Taken From Article, Generative AI in Healthcare
What type of Explanation do we need in Healthcare?
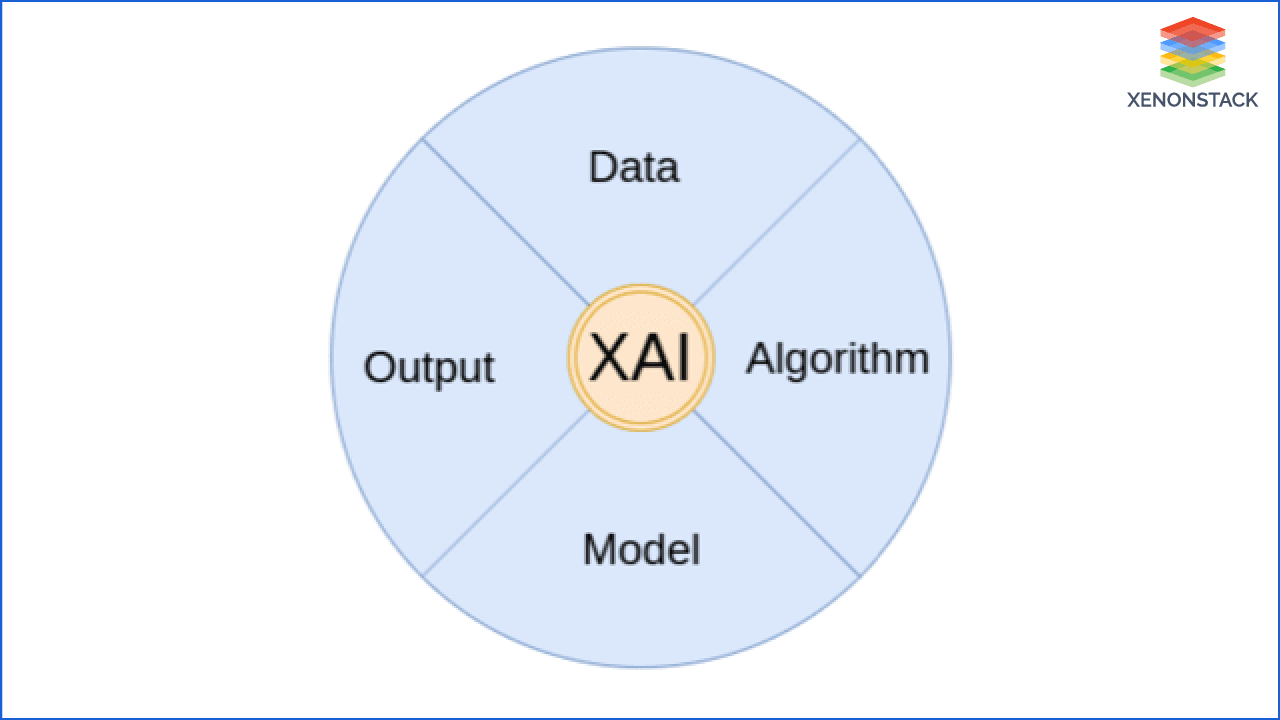
Explainable AI is not just about giving justification for the model's decision. It is worth more than that. Explanation of the output is not enough to solve all the queries of the customer. Akira AI explains each element of the solution process. These are
- Data: It explains the data used for the prediction, their correlation, and EDA (Exploratory Data Analysis) to understand the hidden data patterns. It tells how the data is to be used for the AI system.
- Algorithm: A complete transparency of the system's algorithm is given with the reason why the system chooses it and how it can be beneficial for the prediction.
- Model: Akira AI gives a detailed explanation of model performance and working in a user-friendly manner.
- Output: Akira AI gives a complete justification for the system's output with the reason. It also provides the factors that contribute to influence the result of the system.
How to implement Explainable AI in Diabetes Detection?
There is a step by step approach to implementing AI in Diabetes detection. From selecting data to the deploying system, Akira AI has methodologies and framework that can be implemented for providing the Explanation, such as
- Selection of the right data and preprocess it for the model.
- Precisely select the suitable algorithm for the system.
- Use various frameworks to make the model working transparent.
- Justify the model output and factors on which it depends.
- To use a clear and clean deployment process.
Where to Implement Explainable AI in Healthcare?
It is not required to use the Explainable AI everywhere in Healthcare. There are some cases where it is necessary to maintain privacy; it can be regarding the data and model working. Therefore we have to use Explainable AI precisely only at required places.
- We can use it when we need to give assurance to patients and doctors. Such as to prescribe medicines, to diagnose disease, etc.
- Different approaches can be used for different types of Explanations. We can implement Explainable AI in processes that need performance, trust, and confidence.
RPA will revolutionize the healthcare industry, saving time, energy, and costs, reducing paperwork and working efficiency, and ultimately improving patient care. Click to explore more about Robotics in Healthcare Management
Case Study-Diabetes Prediction System
A system is used to predict whether a patient has diabetes based on some of its health-related details such as BMI (Body Mass Index), blood pressure, Insulin, etc. This system is only for females as the dataset used to make this system exclusively belongs to the females.
Here, it is required to have an accuracy of the model to predict the correct result, as it is about someone's health. A single wrong result can have an adverse effect. Therefore, a good accuracy "Random Forest Classifier" Random Forest model is selected, which provides good accuracy to the system and generates the correct results.
Transparency is equally essential as accuracy so that doctors, as well as the patient, can check whether the output that the system generated is accurate or not. But as we know, Random Forest classifiers belong to the opaque model family and not providing much transparency, making it difficult to understand the algorithm's complex working.
Therefore to balance, both the performance and interpretability of Akira AI, use Explainable AI here.
End Customer Questions
End-user always has some question in their mind regarding the AI system and its working. Akira AI answers all those questions using various Explainable AI methodologies. Some of these question that comes in the customer's mind by looking at the AI in DIabetes Prediction system
- How is data contributing to making a decision?
- Which feature influences the result more?
- How changing the value of that particular feature affect the system output?
- Why did the system say that I can have diabetes in the future?
- What is the amount of Glucose that I need to maintain?
- How much sugar and Insulin should I have to decrease to keep my sugar level?
- What is the general rule that the system used to generate an output?
Which feature influences the result more?
The contribution of features in making decisions can help doctors and patients to trust results.
The figure below depicts the importance of the features in predicting the output. Features are sorted by decreasing the importance from top to bottom to generate the output.
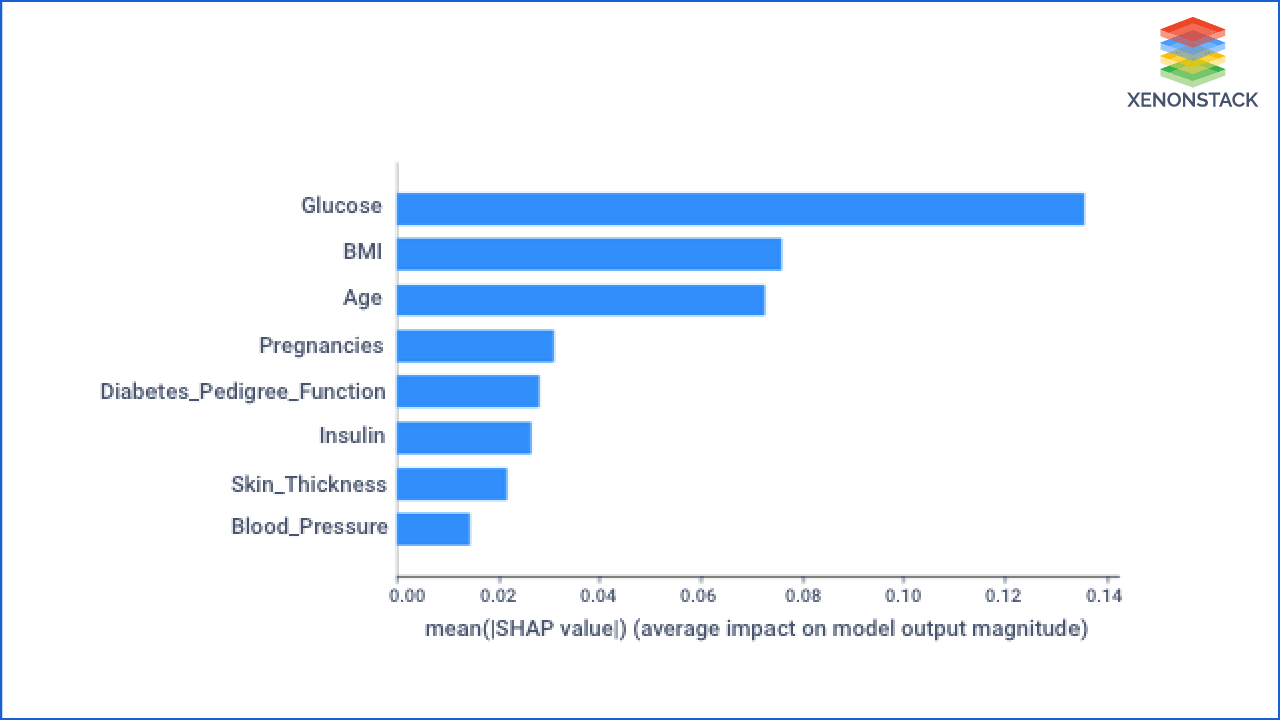
As it is showing, the Glucose value of a person influences the result more while predicting whether a person can have diabetes or not.
How is data contributing to making a decision in Diabetes Detection with AI?
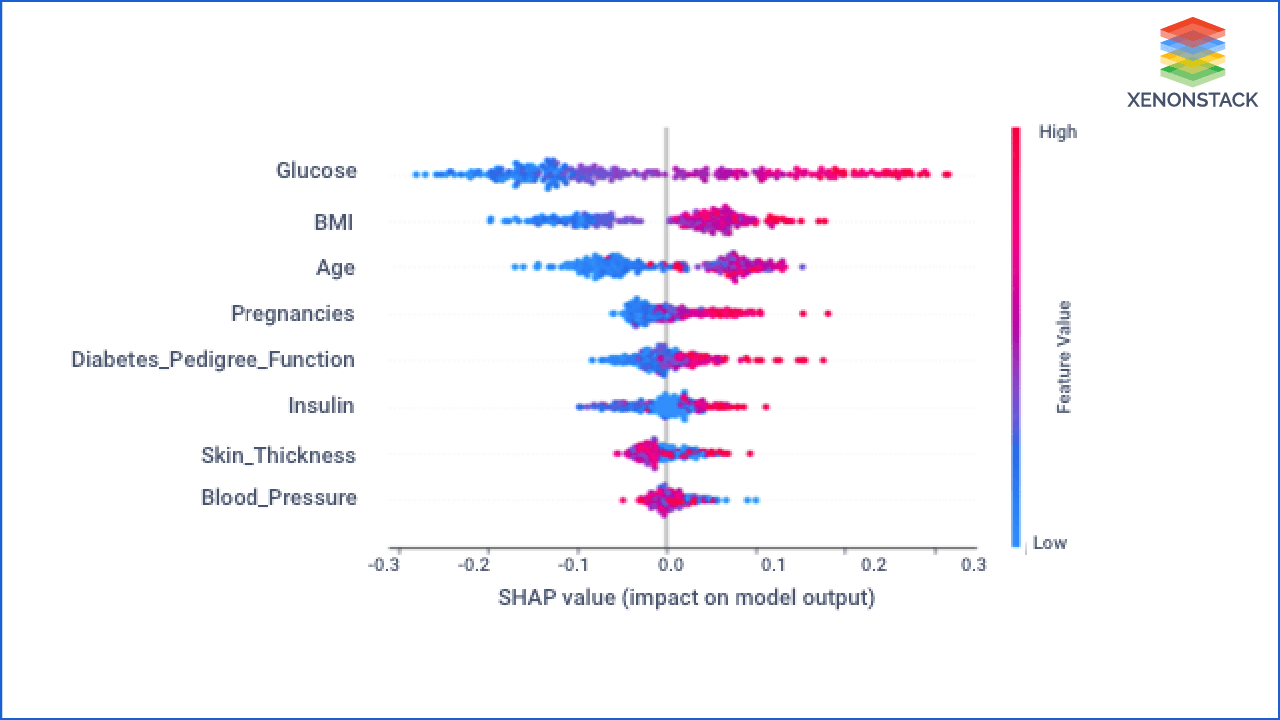
This is the next version of the previous graph. It also shows the same things with some more information about the value of the feature.
- Feature importance: Variables ranked in descending order of importance.
- Impact: The horizontal location display whether the effect of that value is associated with a higher or lower prediction.
- Value: Color display whether that variable is high or low for that observation. Red color devotes the high value and blue for less value. The variation in color of the dot shows the value of the feature.
- Correlation: A high level of "Glucose" content has a high impact on having diabetes. The "high" comes from red color, and the effect is shown on the X-axis.
How does a change in the value of the Glucose change the system output?
After getting the answer to the first question, the customer can ask how the Glucose value change changes the system output when other parameters are not changing?
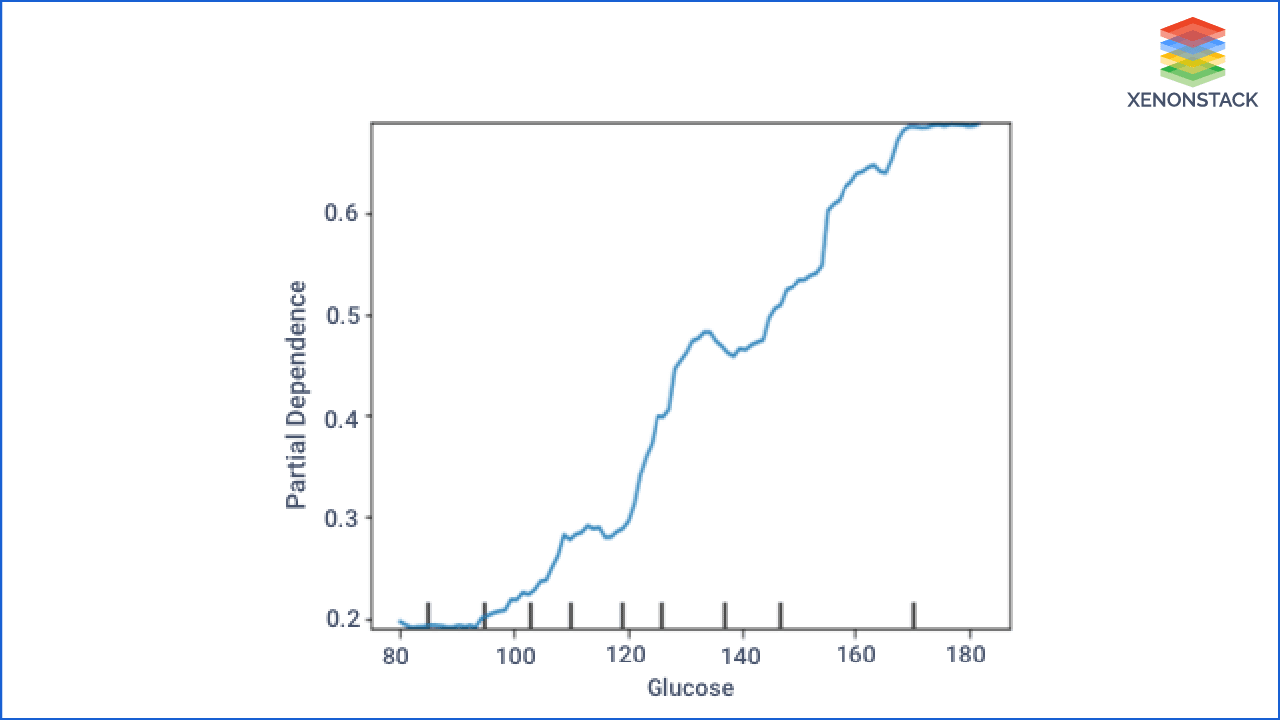
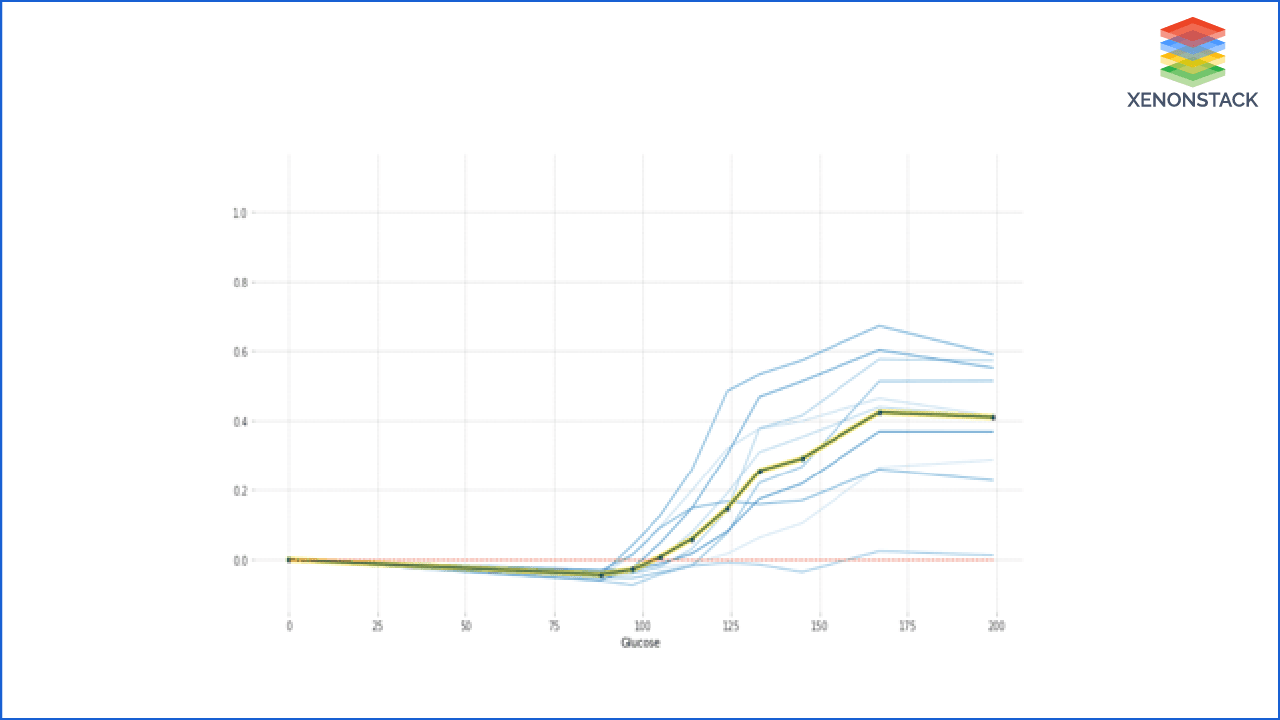
To answer this, let's discuss the Partial Dependence Plot (PDP)
PDP shows the relation between the target response and feature. Other features are marginalized. This graph shows how a change in the value of Glucose changes the predicted output. It depicts that the increase in Glucose's value increases the probability of having diabetes to the person.
ICE (Individual Conditional Expectation) is a more detailed view of PDP. ICE is used to inspect the model's behavior for a specific instance, where everything except Glucose is held constant, fixed to its observed values. At the same time, Glucose is free to attain different values.
In PDP, other features are averaged out, but it took each case individually and the plot graph by only changing salary and remaining others constant. So this is a broad view of PDP.
In the Figure below, we just selected some of the observations. Users are free to choose any number of observations that they want to explore.
Why did the System say I can have diabetes in the future?
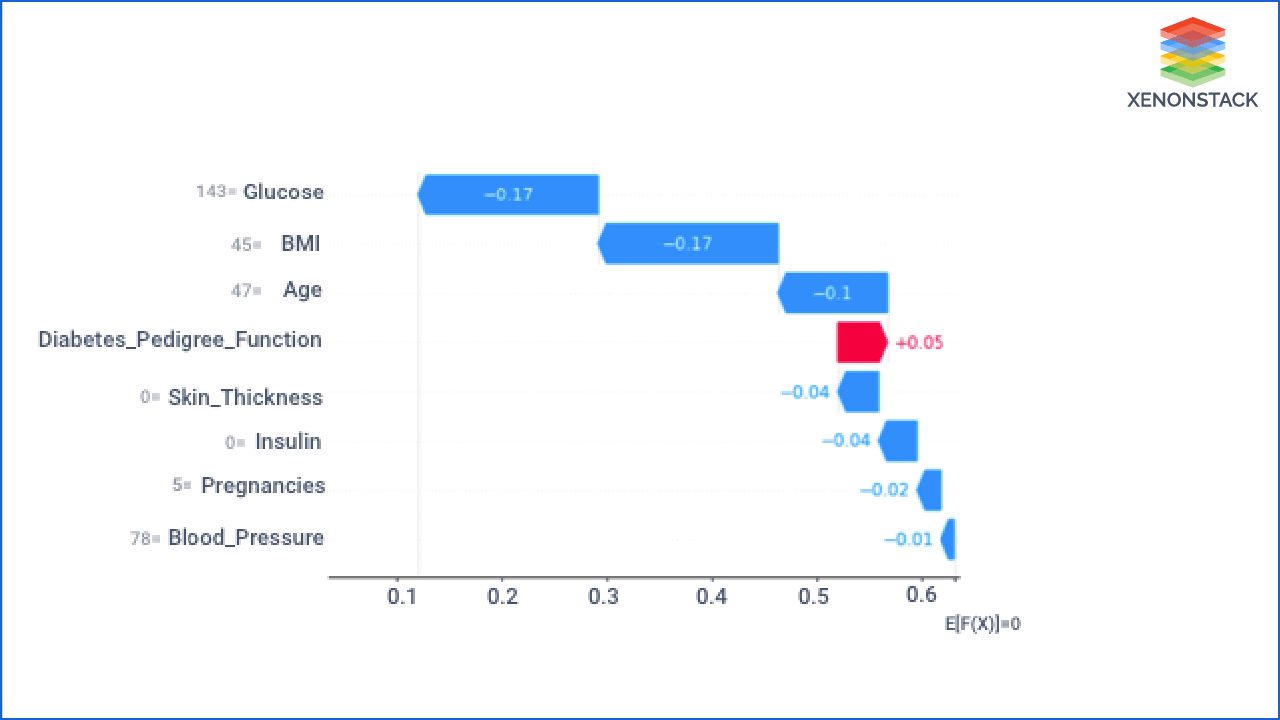
Using SHAP system plots and justify its result is why it chooses individual output. The SHAP value represents the impact of feature evidence on the model's output.
The waterfall plot depicts how each SHAP values feature moves the model output from our prior expectation under the background data distribution to the final model prediction. It gives evidence of all the features.
It displays explanations for individual predictions, so they expect a single row of an Explanation object as input. Each row shows how the positive (red) or negative (blue) contribution of each feature moves the value from the expected model output over the background dataset to the model output for this prediction.
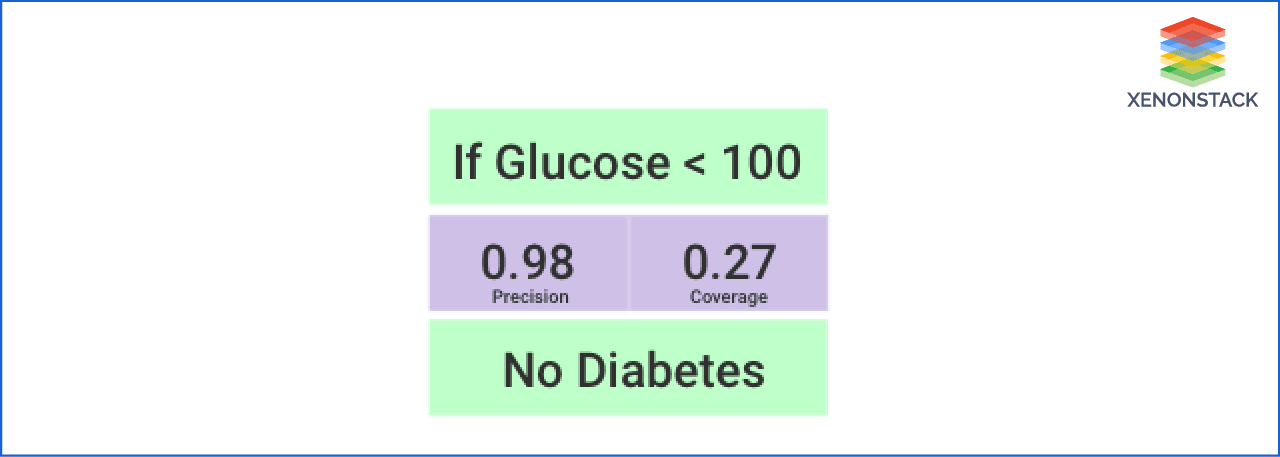
What is the Value of the Glucose need to maintain in body?
The person's glucose value plays a significant part in predicting whether a person can have diabetes. Anchors can answer what Glucose's value that an individual needs to maintain to have diabetes. So this figure depicts that if that person maintains the Glucose value less than 100, it cannot have diabetes.
What is the general rule the system used to generate an output?
This is an essential question. A satisfying answer to that question can clear many doubts about the customers and bring their confidence in the system. If the system can provide the general rule that the system obeys to give the output, it can clear all the doubts regarding the algorithm's working.
We can use various methodologies to answer the question according to the algorithm we used to predict the output as we are using the Random Forest Classifiers Algorithm. Hence, we have some methods such as inTRess, defragTrees, etc., that we can use to extract the Random Forest Algorithm rule.
Here we used the defragTrees method that generates rules that the system used to predict an output, as shown in Figure below. It also provides the performance attributes from which the user can analyze and track the algorithm's performance and rule to predict an output. It follows the model's behavior on a global scale, so they can inspect it and find out whether the model has picked up any undesired functioning.
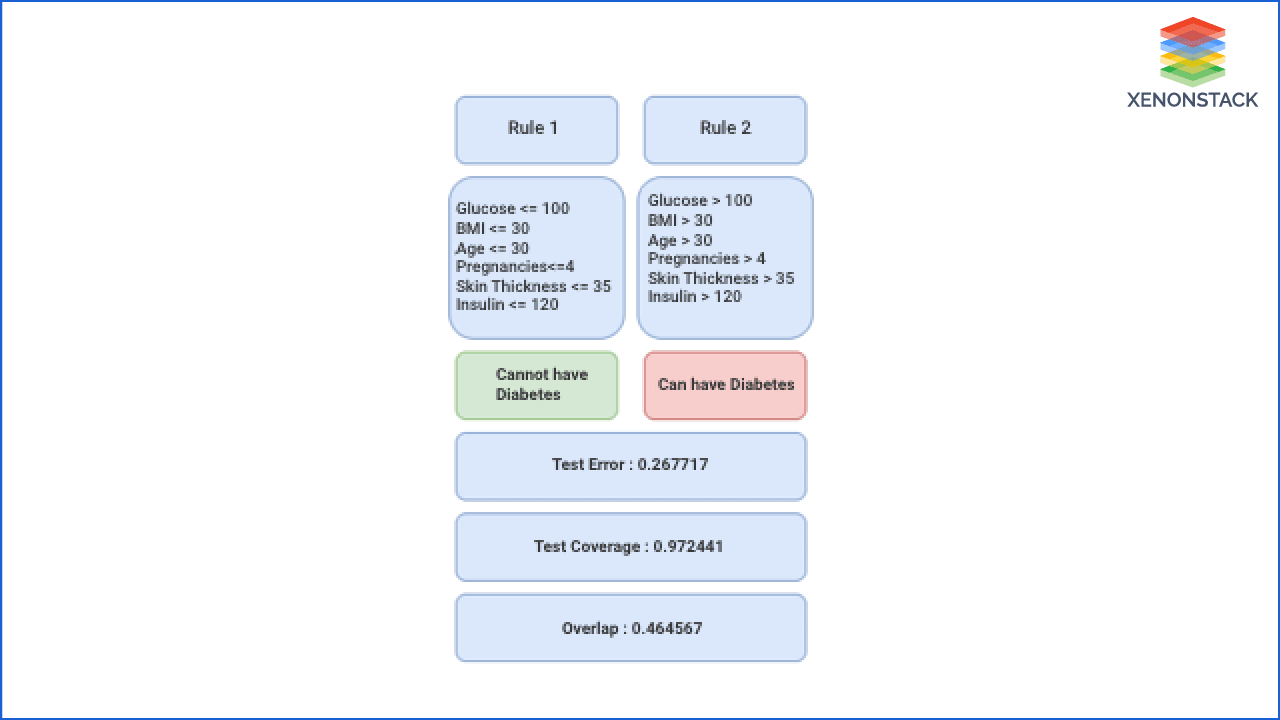
The figure describes two rules on which the system is working. It provides the value of the parameters that help to reach the system at the output. As given in Rule 1, if the value of the Glucose <= 100 and BMI <= 30 and Age <= 30 and Pregnancies <= 4 and Skin thickness <= 35 and Insulin <= 35, then the system will say that a lady doesn't have diabetes. Whereas opposite of these values as given in Rule 2 if the values of the parameters are Glucose > 100 and BMI > 30 and Age > 30 and Pregnancies > 4 and Skin thickness > 35 and Insulin> 35, then it will say that the lady can have diabetes.
It also provides the Test Error, Test coverage, and the Overlap values to understand the system's performance.
AI can accelerate and advance the medical research, prevention, diagnosis, and treatment of diseases. Taken From Article, Responsible AI in Healthcare Industry
Conclusion
Contribution of the Explainable AI in Diabetes Prediction system makes it easy for the end-user to understand the AI systems' complex working. It provides a human-centered interface to the user. Explainability is a key to producing a transparent, proficient, and accurate AI system that can help the healthcare practitioner, patients, and researcher understand and use the system.
- Explore here about Data Analytics in Healthcare Industry
- Read here about Explanable AI in Healthcare


