
.webp?width=1921&height=622&name=usecase-banner%20(1).webp)
Introduction to Apache Druid
It is a real-time analytics database designed for rapid analytics on large datasets. This database is often used for powering cases where real-time ingestion, high uptime, and fast query performance are needed. Druid can be used to analyze billions of rows not only in batch but also in real-time.
It offers many integrations with technologies like Apache Kafka Security, Cloud Storage, S3, Hive, HDFS, DataSketches, Redis, etc. It also follows the immutable past and append-only future. Past events happen once and never change, but these are immutable, whereas the only append takes place for new events. It provides users with a fast and deep exploration of large-scale transaction data.
A cloud computing managed service offering model that enables users to set up, operate, manage and scale with some form of access. Click to explore about our, Internal Developer Platform
Characteristics of Apache Druid
Some of the exciting characteristics are:
-
Cloud-Native, making easy horizontal scaling
-
Supports SQL for analyzing data
-
REST API enabled for querying or uploading data
What are its use cases?
Some of the everyday use cases of Druid are:-
Clickstream analytics
-
Server metrics storage
-
OLAP/Business intelligence
-
Digital Marketing/Advertising analytics
-
Network Telemetry analytics
-
Supply chain analytics
-
Application performance metrics
What are its key features?
Druid’s core architecture combines the ideas of different data warehouses, log search systems, and time-series databases.
Columnar Storage Format
It uses column-oriented storage, so it only loads the columns needed for a particular query. This helps in fast scans and aggregations.
Parallel Processing
It can process a query in parallel across the entire cluster, which is also known as Massively Parallel Processing.
Scalable Distributed System
Druid is mainly deployed in clusters ranging from tens to hundreds that offer ingest rates of millions of records/sec, query latencies of sub-second to a few seconds, and retention of trillions of records.
Real-time or Batch Ingestion
Druid can ingest data either in real-time (Ingested data can be queried immediately) or in batches.
Cloud-Native
It is a fault-tolerant architecture that won’t lose data. Once Druid ingests data, its copy is safely stored in deep storage (Cloud Storage, Amazon S3, Redis, HDFS, many more). Users' data can be easily recovered from this deep storage even if all the Druid’s servers fail. This replication ensures that queries are still possible while the system recovers.
Indexing
Druid uses concise and roaring compressed bitmap indexes to create indexes that help in faster filtering.
Timestamp Partitioning
Every data in Druid must have a timestamp column, as it is always partitioned by time, and every query has a time filter.
Easy Integration with Existing Pipelines
Users can easily stream data natively using Druid from message buses like Kafka, kinesis, and many more. It can also load batch files from the data lakes like HDFS and Amazon S3.
General Architecture of Apache Druid
Druid is mainly composed of the following processes:
-
Coordinator – This process manages data availability on the cluster.
-
Overlord – This process controls the assignment of data ingestion workloads.
-
Broker – This helps handle queries from external clients.
-
Historical – This process stores data that is queryable.
-
Middle manager – This process is responsible for ingesting the data.
Explore Apache Druid Managed Services
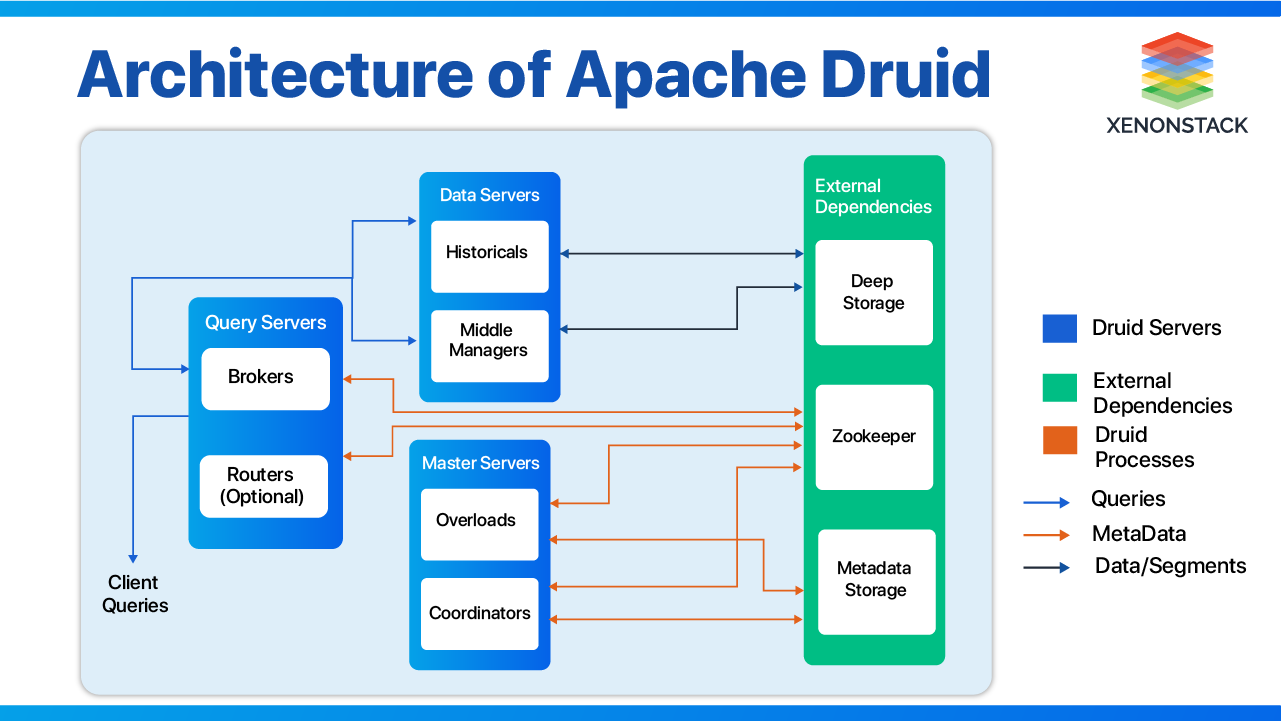 The processes described above are organized into 3 types of servers: Master, Query, and Data.
Master
It runs the Coordinator and Overlord and manages significant data ingestion and availability. Master is responsible for ingesting jobs and coordinating data availability on the “Data Servers.”
Query
It runs Brokers and Optional Router processes. It handles queries and external clients by providing the endpoints of applications that users and clients interact with, routing queries to Data servers or other Query servers.
Data
It runs Middle Managers and Historical processes, which help execute jobs and store queryable data. In addition to these three servers and six processes, Druid also requires storage for Metadata and Deep Storage.
Metadata Storage
It stores the system's metadata (Audit, Datasource, Schemas, and so on). For experimental purposes, the environment suggested using Apache Derby. Derby is the default metadata store for Druid, but it is unsuitable for production. For production purposes, MySQL or PostgreSQL is the best choice.
Metadata storage stores all the metadata, which is very useful for the cluster of Druid to work. Derby is not used for production as it does not support a multi-node cluster with high availability. MySQL, as a metadata storage database, is used to acquire:
-
Long term flexibility
-
Scaling on budget
-
Good with large datasets
-
Good high read speed
- Complex database designs
- Performing customized procedures
- Diverse indexing technique
- Variety of replication methods
- High read and write speed.
Deep Storage
Apache Druid uses separate storage for any data ingested, which makes it fault-tolerant. Some Deep Storage Technologies are Cloud Storage, Amazon S3, HDFS, Redis, and many more.
A structure that defines the logical view of the entire defines how the data is managed and how the relations among them are associated. Click to explore about our, Types of Databases
Data Ingestion in Druid
Data in Druid is organized into segments with rows up to a few million. Loading data in Druid is known as Ingestion or Indexing. Druid fully supports batch and streaming ingestion.
Some of the technologies supported by Druid are Kinesis, Cloud Storage, Apache Kafka, and local storage. Druid requires some structure to the data it ingests. Data should generally consist of OS timestamps, metrics, and dimensions.
Zookeeper for Apache Druid
Ittransf uses Apache Zookeeper to integrate all the solutions. Users can use Zookeeper, which comes with Druid, for experiments, but one has to install Zookeeper for production. Its cluster can only be as stable as a Zookeeper. Zookeeper is responsible for most communications that keep the Druid cluster functioning, as Druid nodes are prevented from talking to each other. 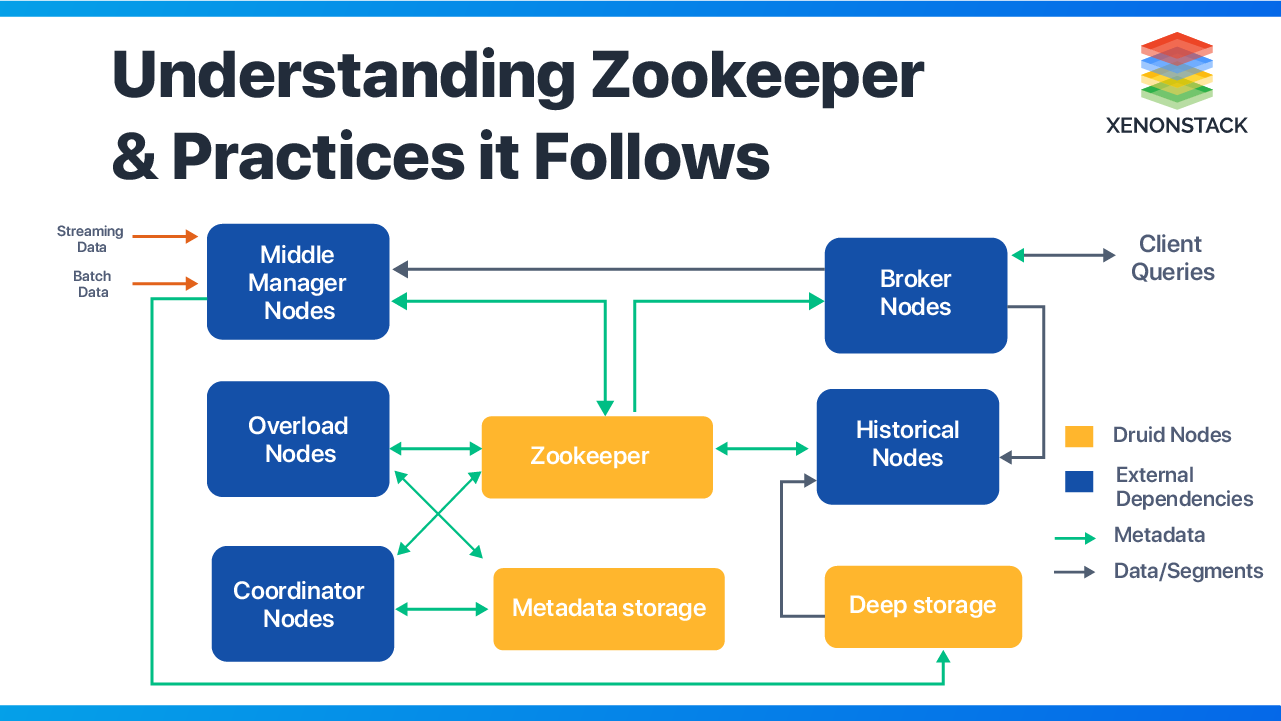
Duties of a Zookeeper
Zookeeper is responsible for the following operations:-
Segment “publishing” protocol from Historical
-
Coordinator leader election
-
Overlord and MiddleManager task management
-
Segment load/drop protocol between Coordinator and Historical
-
Overlord leader election
How to Keep a Zookeeper Stable?
For maximum Zookeeper stability, the user has to follow the following practices:-
A Zookeeper should be dedicated to Druid; avoid sharing it with any other products/applications.
-
Maintain an odd number of Zookeepers for increased reliability.
-
For highly available Zookeeper, 3-5 Zookeeper nodes are recommended. Users can install Zookeeper on their system or run 3 or 5 master servers and configure Zookeeper on them appropriately.
-
Share the Zookeeper’s location with a master server rather than doing so with data or query servers. This is done because query and data are far more work-intensive than the master node (coordinator and overlord).
-
To achieve high availability, it is recommended never to put the Zookeeper behind a load balancer.
If Zookeeper goes down, the cluster will operate. Failing Zookeeper would neither result in addition to new data segments nor can it effectively react to the loss of one of the nodes. So, the failure of Zookeeper is a degraded state.
The IDP is an excellent solution for meeting the ever-increasing demand for faster development and release cycles with total automation.Click to explore about our, Database-as-a-Service
How to monitor Apache Druid?
Users can monitor Druid using the metrics it generates. Druid generates metrics related to queries, coordination, and ingestion. These metrics are emitted as a JSON object. They are either emitted to a runtime log file or over HTTP (to a service like Kafka). The emission of a metric is disabled by default.
Fields of Metrics Emitted
Metrics emitted by Druid share a standard set of fields.- Timestamp – the time at which the metric was created
- Metric – the name given to the metric
- Service – the name of the service that emitted the metric
- Host – the name of the host that emitted the metric
- Value – the numeric value that is associated with the metric emitted
Briefing About Available Metrics
The metric emitted may have dimensions beyond the one listed. To change the emission period of Druid, which is 1 minute by default, one can use `druid.monitoring. Emission period` to change the default value. Metrics available are:-
Query Metrics, mainly categorized as Broker, Historical, Real-time, Jetty and Cache
-
SQL Metrics (Only if SQL is enabled)
-
Ingestion Metrics (Kafka Indexing Service)
-
Real-time Metrics (Real-time process, available if Real-time Metrics Monitor is included)
-
Indexing Service
-
Coordination
-
JVM (Available if JVM Monitor module is included)
-
Event Receiver Firehose (available if Event Receiver Firehose Monitor module is included)
-
Sys (Available if Sys Monitor module is included)
-
General Health, mainly Historical

A process that describes task description, time requirements, Deliverables, and pitfalls. Download to explore the potential of Data Warehouse.
Apache Druid is the best in the market for analyzing data in clusters and providing brief insight into all the data processed. Plus, having a Zookeeper by the side eases one's work with it and allows one to rule the DataOps market. Also, there are many libraries to interact with it.
To Validate the service's running, one can use JPS commands. As Druid nodes are Java processes, they would show up when the JPS command '$ jps—m' is used. With that much ease in monitoring Druid and working with such a vast architecture of Druid, it is the last bite of ice cream for a DataOps Engineer.
- Get insight on Platform as a Service (PaaS) in Cloud Computing
- Discover more about CaaS Architecture and Management Solutions


