Key takeaway
- Visual communication uses images, charts and design to convey ideas fast. Learn the hierarchy principles, formats, accessibility rules and the AI role.
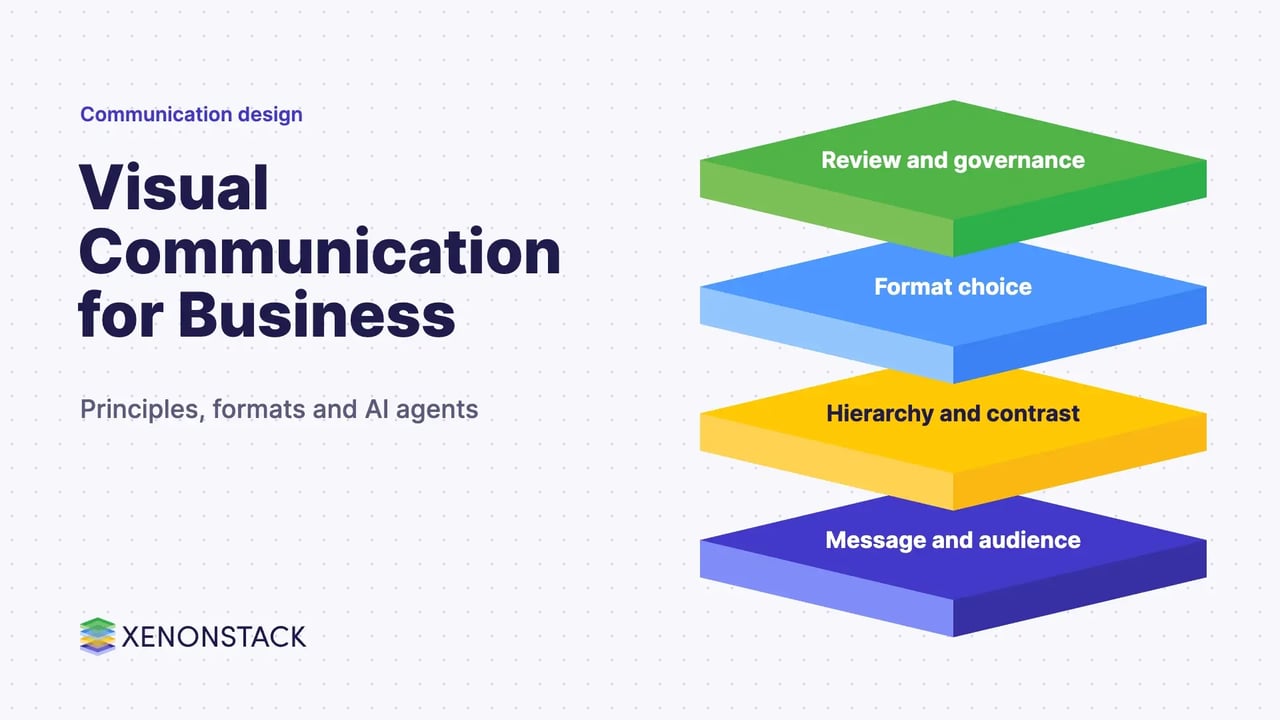
Visual communication is the use of images, typography, colour, layout, charts and video to carry a message that words alone would make slower or harder to grasp. It covers everything from a slide or a dashboard to signage, packaging and a brand's visual system.
This guide is for marketing, product and communications leaders who need visuals to do real work in a business. It covers the main forms, the design principles that make them readable, how to choose a format, and how AI agents change the way visual material is produced. It also sits beside our guides to user interface design and user experience design tools.
What is visual communication?
It is the practice of expressing concepts graphically so the message gains depth and can be understood quickly. The forms include signage, typography, drawings, graphic design, illustration, industrial design, advertising, animation and electronic resources. It supports digital transformation work by explaining complex ideas, and it shows up in retail digital transformation where the customer experience is largely visual.
Visual communication is also among the oldest forms of human communication. Cave paintings and later pictograms carried meaning across languages, and printing made visual and written material easy to copy and share.
Which elements make a visual easy to understand?
The Nielsen Norman Group defines visual hierarchy as "the organization of the design elements on the page so that the eye is guided to consume each design element in the order of intended importance". Its guidance gives a practical checklist.
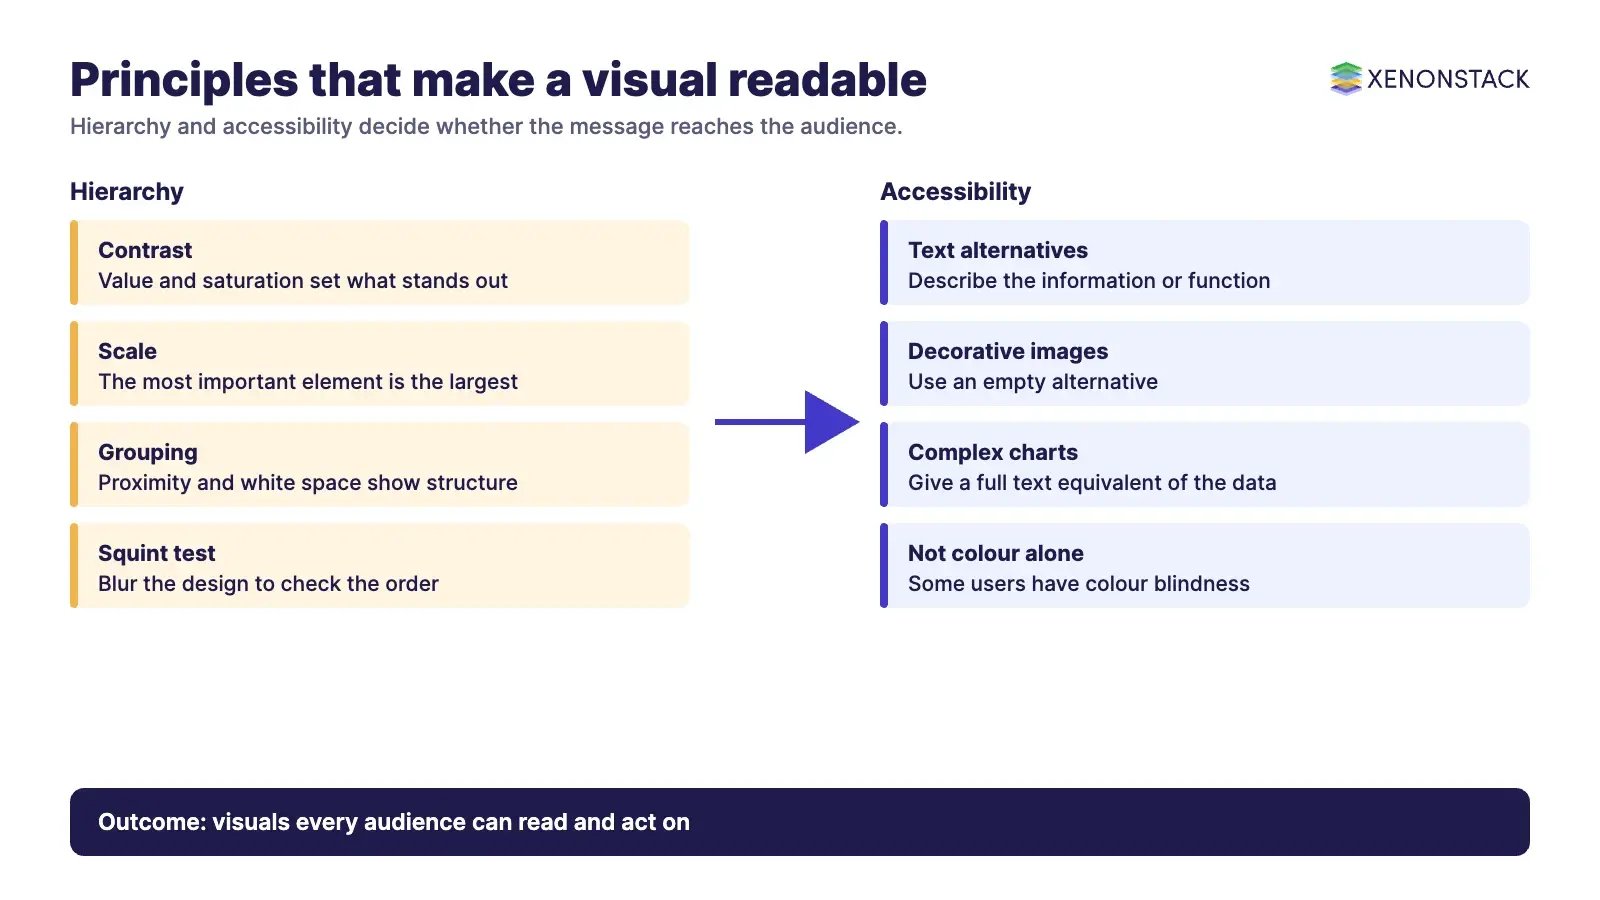
| Principle | What it means | Practical rule from the source |
|---|---|---|
| Contrast | Hierarchy comes from contrast in value and saturation against the context | "If everything is contrasted, then nothing stands out" |
| Scale | Size signals importance | Use few sizes, and make the most important element the largest |
| Grouping | Proximity, white space and enclosures show structure | Let important elements breathe and use containers sparingly |
| Colour | A small palette keeps meaning clear | Do not rely on colour alone, because some users have colour blindness |
| Squint test | Blur the design to see its hierarchy | Check that the intended groups and order still show |
Accessibility belongs here too. The W3C Web Accessibility Initiative tutorial on images says images need text alternatives that describe the information or function they convey. Informative images get a short description, decorative images get an empty alternative, and complex images such as charts need a complete text equivalent of the data.
Which types of visual communication should you use?
| Format | Best for | Watch for |
|---|---|---|
| Charts and data visualisation | Comparing numbers and showing trends | A text equivalent for the data, and honest axes |
| Infographics | Explaining a process or a set of related facts | Too many elements competing for attention |
| Screenshots and screen recordings | Showing how a product or workflow behaves | Out of date screens |
| Video and animation | Demonstrations and stories | Captions and a clear single message |
| Slide decks | Presenting a decision or a plan | Text-heavy slides that repeat the speaker |
| Social media graphics | Short, shareable points | Legibility at small sizes |
| GIFs | Quick demonstrations of one action | Motion that distracts from the message |
Dashboards and cloud monitoring views are a visual channel too, and they matter in multi-cloud management, where teams read status and cost at a glance.
Why does visual communication matter for business?
- A strong visual makes a first impression and can carry feeling that plain text does not.
- Visual explanations help people grasp a complex idea or dataset sooner, which shortens decisions.
- Consistent visuals support a brand and a shared identity across channels, see our guide to designing the brand identity.
- Visual cues guide people through products and services, which is why interface and conversation design draw on it, as in the principles of conversational user interfaces.
How do AI agents change visual communication?
Agents can draft charts from approved data, prepare first versions of slides, check a layout against a brand guide, and write alternative text for review. That speeds production, and it raises a governance question: every number in a generated chart should trace to a source a person can inspect. Visual output also needs the same review as written output, since a persuasive chart can mislead if its data is wrong. ElixirData is XenonStack's Context OS, which keeps the governed data behind agent output in one place. Related reading includes artificial intelligence in customer experience and the Digital Immune System.
What should you do first?
- Pick one audience and one message, and choose the simplest format that carries it.
- Apply contrast, scale and grouping, then run the squint test.
- Add text alternatives and captions before publishing.
- Check every figure against its source.
- Keep a short style guide so the next visual looks like part of the same system.
To map one decision your agents make, and the data and policy it depends on, book a Context Workshop. See what happens in the workshop.
Frequently asked questions
What is visual communication?
It is the use of images, typography, colour, layout, charts and video to carry a message quickly and clearly.
What makes a visual easy to read?
Clear hierarchy built from contrast, scale and grouping, a small colour palette, and a check such as the squint test to confirm the intended order shows.
Do visuals need text alternatives?
Yes. The W3C Web Accessibility Initiative says images need text alternatives describing the information or function they convey, with an empty alternative for purely decorative images.
Which visual format should a business use?
Choose by the job: charts for numbers, screen recordings for product behaviour, video for demonstrations and slides for decisions.
How can AI agents help with visual communication?
They can draft charts from approved data, prepare slide first drafts and check layouts, while people review the data and the message before anything is published.
Ready to put AI agents to work? See an ElixirClaw demo: the agentic OS to build, orchestrate and govern AI agents across your enterprise systems.
Explore the XenonStack platform family: ElixirData · ElixirClaw · ElixirHub · NexaStack · MetaSecure · Neural AI · AgentGRC · AgentSRE · AgentAnalyst · AgentInstruct · AgentRAI · AgentScrum · AgentSearch · AgentForce · AI Aviator · SAIF Aviator · CohortIQ · XenonStack AI · XenonStack UAE