

Key takeaway
- Snowflake data quality monitoring with AI: how DMFs, expectations, anomaly detection and alerts work, what they cost, and where native checks stop.
AI data quality monitoring in Snowflake combines three things: rule-based checks (data metric functions and expectations), machine-learning anomaly detection on volume and freshness, and alerting that reaches the people who own the data. All three are native features in Snowflake Enterprise Edition. They run on a schedule you set, and the default is once an hour, so "real time" in practice means as often as your schedule and cost budget allow. For the validation rules that sit underneath, see our guide to Snowflake data validation, native features and limits.
For a CIO, CDO or data platform lead, the decision is not whether to monitor but where to draw the line between native checks, anomaly detection and a governed layer above the warehouse. This guide sets out what Snowflake provides today, what it costs, where it stops, and the order in which to adopt it. It builds on our overview of data quality management.
What does AI data quality monitoring in Snowflake include?
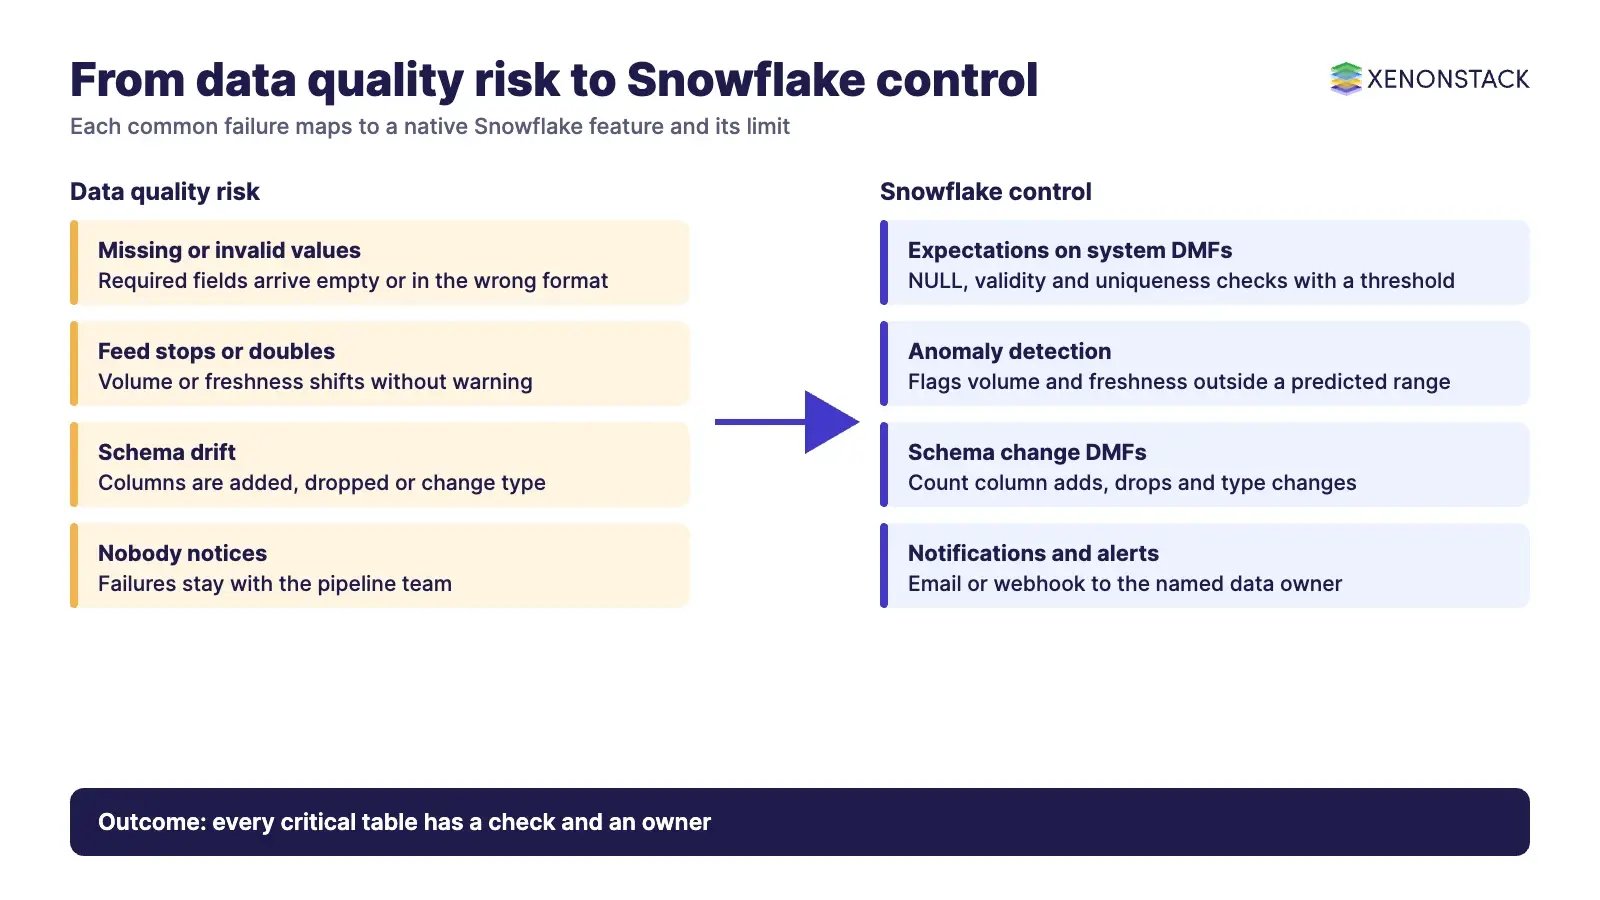
Snowflake describes data quality checks as a way to continuously validate the health of your data. Cortex Data Quality can suggest checks based on metadata and usage patterns, and once checks are configured they run on a schedule and report violations. The table below separates the parts so that each can be judged on its own.
| Capability | What it does | When it fits | Current status (Snowflake docs) |
|---|---|---|---|
| Data metric functions (DMFs) | Measure an attribute such as NULL count or freshness and return a value | Any table or view you need to measure | System and custom DMFs; Enterprise Edition |
| Expectations | Turn a DMF value into a pass or fail check | Rules with a clear threshold, such as zero NULL emails | Set in Snowsight or SQL |
| Anomaly detection | Flags DMF values outside a range predicted from history | Volume and freshness where fixed thresholds are hard to set | Covers volume and freshness only, at present |
| Cortex Data Quality suggestions | Proposes checks from metadata and usage patterns | Teams starting with many unmonitored tables | Listed in the data quality overview |
| Notifications and alerts | Tell owners when an expectation fails or an anomaly appears | Any check with a named owner | Email and webhook integrations |
How do data metric functions and expectations work?
A data metric function measures; it does not judge. An expectation is combined with a DMF to form a check, and values that fail the expectation are reported as expectation violations. The left side of an expectation must be the keyword VALUE, so a rule such as "no NULL emails" is written as VALUE = 0 against a NULL count.
Schedule is set with the DATA_METRIC_SCHEDULE parameter on a table, view or materialized view, and all DMFs on one object share it. The default is one hour. You can use minutes (for example five), a cron expression, or TRIGGER_ON_CHANGES to run when DML such as inserts changes the data. Results are read from the DATA_QUALITY_MONITORING_RESULTS view, filtered on measurement time rather than scheduled time.
Which system DMFs exist?
Snowflake ships system DMFs in several groups, so most teams start without writing any custom function. Custom DMFs cover metrics with no system equivalent.
| Group | Examples | Question it answers |
|---|---|---|
| Completeness | NULL_COUNT, BLANK_COUNT, EMPTY_STRING_COUNT | Are required values present? |
| Uniqueness | DUPLICATE_COUNT, UNIQUE_COUNT | Are keys duplicated? |
| Validity | ACCEPTED_VALUES, INVALID_EMAIL_COUNT, REFERENTIAL_INTEGRITY_COUNT | Do values meet format and reference rules? |
| Freshness and volume | FRESHNESS, SOURCE_TARGET_LAG, ROW_COUNT, ROWS_IN_PAST_DAY_COUNT | Is data arriving on time and in the expected quantity? |
| Schema | SCHEMA_CHANGE_COUNT, SCHEMA_CHANGE_ADD_COUNT, SCHEMA_CHANGE_DROP_COUNT | Did columns change between evaluations? |
| Outliers | OUTLIER_ZSCORE_COUNT, OUTLIER_IQR_COUNT | Are values statistically unusual? |
Where does AI add value beyond fixed rules?
Fixed rules catch what you already know to look for. Anomaly detection learns the normal range for a DMF from historical values and flags those outside the predicted range. Snowflake states that this currently covers the volume and freshness of data, which are the two failures that most often hit dashboards first: a feed that stops, or one that suddenly doubles.
The outlier and schema-change DMFs add statistical coverage for unusual values and structural drift. Anything beyond that, such as predicting that a feed will arrive late or classifying why a record is wrong, needs your own models or a layer above the warehouse. Treat that as a design choice and not as a Snowflake feature.
How should alerts and notifications be set up?
There are two routes. Data quality notifications fire when an expectation is violated or an anomaly is found. You choose recipients (email addresses, an email integration, or a webhook integration for tools such as Slack), grant the MANAGE DATA QUALITY privilege to the database owner, and enable settings with ALTER DATABASE ... SET DATA_QUALITY_MONITORING_SETTINGS. The settings include a cooldown in hours, which stops repeat messages for the same problem.
Snowflake alerts are the second route, for conditions you write yourself. An alert has a condition, an action and a schedule. A scheduled alert checks all existing data; a new-data alert checks only newly inserted rows and needs change tracking on a single table or view. Alerts can run on serverless compute or a named warehouse. New alerts are suspended by default, so they need an explicit RESUME. See our guide to agentic AI with Snowflake for how alert actions can hand work to agents.
What does it cost, and what are the limits?
Scheduled DMF runs use serverless compute and are billed under the Data Quality Monitoring category. Creating a DMF is free, and unscheduled calls such as a SELECT are not billed. Logging to the event table is billed separately. You can track spend with the DATA_QUALITY_MONITORING_USAGE_HISTORY view. A faster schedule therefore raises cost directly, which is the main trade-off in "real-time" monitoring.
| Constraint | What the docs say | What it means for you |
|---|---|---|
| Edition | Enterprise Edition; trial accounts not supported | Confirm edition before planning a pilot |
| Table types | Standard, dynamic, external, Iceberg, event tables, views and materialized views; hybrid tables and streams not supported | Check hybrid-table workloads separately |
| Scale | Up to 50,000 DMF associations per account | Plan coverage by criticality, not by every table |
| Sharing | No DMFs on shared objects or reader-account objects | Monitor at the provider side |
| Anomaly scope | Volume and freshness only | Use expectations for everything else |
What is a sensible adoption sequence?
Pick critical tables. Start with the few tables behind regulatory reports, board dashboards and AI features. Name an owner for each.
Apply system DMFs. Use completeness, uniqueness, freshness and schema DMFs first, with expectations that match a written business rule.
Add anomaly detection. Turn it on for volume and freshness where a fixed threshold is hard to set.
Route notifications. Send each failure to the owner with a cooldown, and escalate by severity. Show status in whichever BI tool your teams already use, with red, amber and green states and a drill-down to the failing check.
Measure the monitoring itself. Review schedule cost, alert volume and time to resolve each quarter, and tune schedules accordingly.
Automate remediation carefully. Begin with human-approved fixes such as reprocessing a failed load, and widen only where the audit trail supports it.
How do governance and automated remediation fit in?
Detection is the easy half. The harder question is who may change data when a check fails, and what record proves it. Automated fixes, such as re-running a pipeline step or restoring a prior state, should run under named roles with logged approvals so that auditors can see what changed and why. Where your regulatory regimes (for example GDPR, HIPAA or SOX) apply, check the specific control you must evidence, because a monitoring dashboard alone is not evidence.
A governed layer above the warehouse helps here. ElixirData Context OS keeps governed context, versioned policy and decision traces in one decision layer above AI agents, and AgentGRC keeps autonomous agent actions inside policy, with the audit trail risk teams need. For building and orchestrating the remediation workflows themselves, ElixirClaw is an agentic OS platform to build, orchestrate and govern AI agents and automation workflows while keeping humans in control. For the warehouse itself, see our Snowflake architecture guide.
When is native monitoring not enough?
Native monitoring fits well when your data already lives in Snowflake and the failures are completeness, validity, freshness or volume. It fits less well when data quality depends on business context held outside the warehouse, when you need predictions beyond volume and freshness, or when many platforms feed one decision. In those cases keep Snowflake checks as the first line and add a cross-platform layer for context, policy and decision records.
To map one data quality decision your agents should make, and the context and policy it depends on, book a Context Workshop. See what happens in the workshop.
Frequently asked questions
Is Snowflake data quality monitoring really real time?
It runs on a schedule. The default is one hour, and you can set minutes, a cron expression or TRIGGER_ON_CHANGES. Faster schedules cost more because DMF runs are billed as serverless compute.
Which edition do I need?
Snowflake Data Quality Monitoring requires Enterprise Edition, and trial accounts do not support it.
What does Snowflake anomaly detection cover?
Currently the volume and freshness of data. It uses historical DMF values to flag results outside a predicted range.
How do I get notified when a check fails?
Enable data quality notifications on the database with email recipients or an email or webhook integration, and set a cooldown. For custom conditions, create a Snowflake alert, which is suspended until you resume it.
What are the main limits?
Up to 50,000 DMF associations per account, no DMFs on shared objects, and no support for hybrid tables or streams.
Explore the XenonStack platform family: ElixirData · ElixirClaw · ElixirHub · NexaStack · MetaSecure · Neural AI · AgentGRC · AgentSRE · AgentAnalyst · AgentInstruct · AgentRAI · AgentScrum · AgentSearch · AgentForce · AI Aviator · SAIF Aviator · CohortIQ · XenonStack AI · XenonStack UAE


