.webp?width=1921&height=622&name=usecase-banner%20(1).webp)
Overview of Public Safety Analytics
In the Public Safety sector, the customer's primary requirement is to get about the rescues and total survey completed of it before investing. Real-time and the support of clients journey, proactively anticipating clients needs. Today's customers also want to know about the prediction of rescued requests and people's surveys and status for the following safety.
Further, the customer wants to get detailed insights about the sector with the requested rescues and helmet and seat belt status year to year analysis. Machine learning models help them predict the people and rescues status to get insights related to the performance. Therefore Public Safety analytics is necessary.
Solution Public Safety Data Analytics
-
With Xenonstack Support, one can build accurate and predictive models in real-time data. To better understand the people for rescues and detect a person while wearing the seat belt and helmet.
-
As a result, we have given a demo of dashboards for reference; you will be confident after getting the details with the proper status as an AI-based predicted model.
Why Xenonstack?
Click on the Button and request us to give you the demo of our Machine Learning prediction model. Here you will get insights related to total surveys and recuses and recuses asked for a status.
Our model will provide you an accurate prediction of all the information like a helmet and set belt status and the monthly status of a customer's rescues and status.
Public Safety Data Analytics Dashboard
[caption id="" align="alignnone" width="640"] 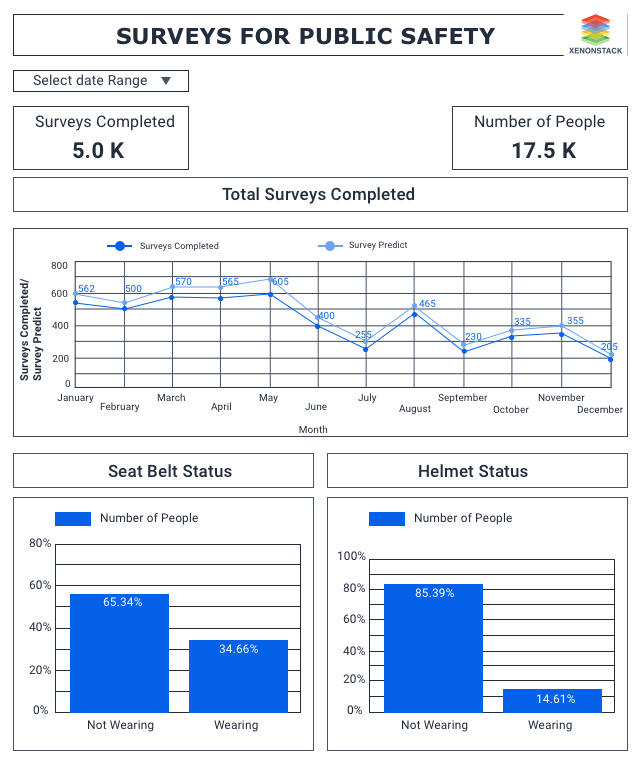 Public Safety Analytics dashboard for analyzing the citizens' safety in their organizations, territory from threats or attacks.[/caption]
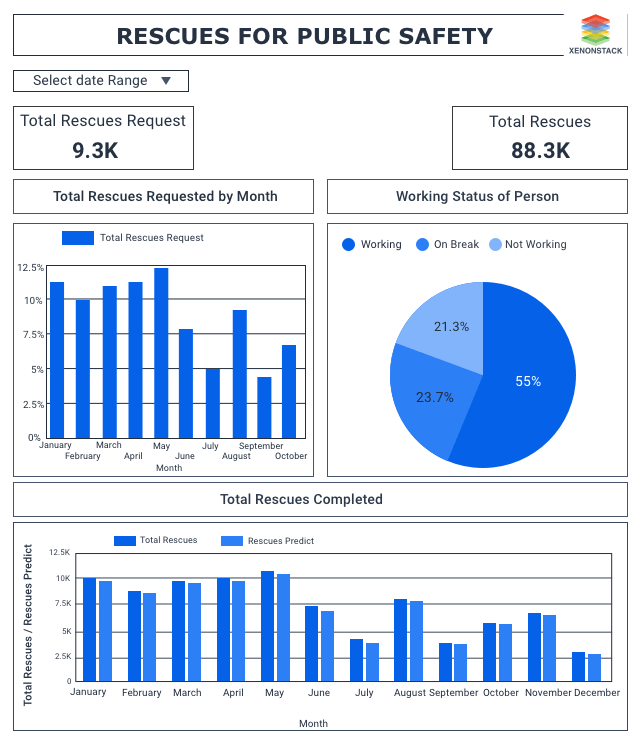
Dashboard Description
Described below are the benefits of the Public Safety Analytic Dashboard.-
Here our dashboard shows the ratio of a person wearing a seatbelt and helmet while running their vehicle; here, around 85% of the users are not wearing it.
-
Users will get to know about the survey completed, total rescues, and the total rescues requested.
-
Here, users will also get to know about the working status of the person for rescues, and users can see the monthly basis status of total surveys, rescue, and rescues requested. Here, the predicted results will be displayed monthly for a total survey and total rescues.