Key takeaway
- How to build and scale Java microservices with Spring Boot, Spring Cloud and Docker, and monitor them with Prometheus, Grafana and cAdvisor.
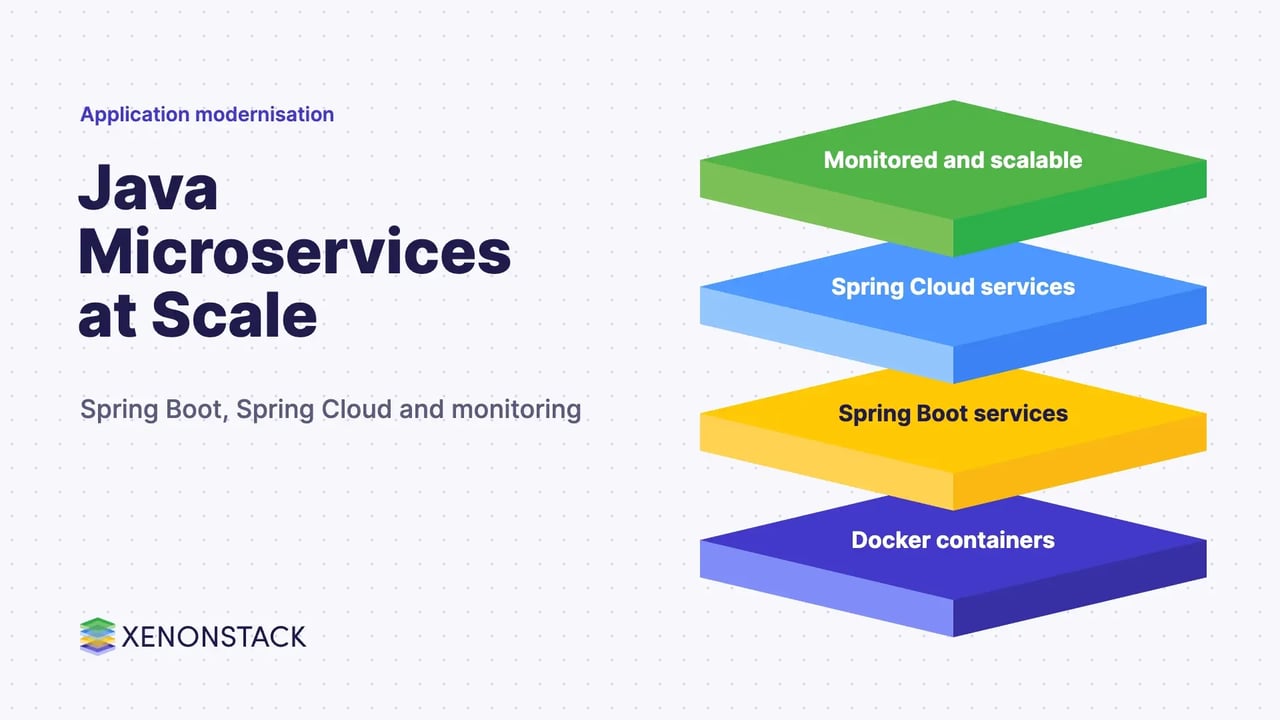
Java microservices are small, independently deployable services built with Java, usually on Spring Boot, that together make up one application instead of a single large program. Each service owns one function with a well-defined interface, so teams can build, deploy and scale it on its own.
This page is for architects and engineering leaders who run or plan Java services on containers. It covers why teams move away from monoliths, what Spring Cloud adds, how to monitor distributed services, where AI agents fit and what to check before you scale.
What are Java microservices?
Java microservices are a form of service-oriented architecture in which an application is built as a collection of smaller services rather than one whole app. The services run on their own and can be written in different languages. This style is described as a method of developing software systems around single-function modules with well-defined operations and interfaces. For more, read Microservices with Java and Golang.
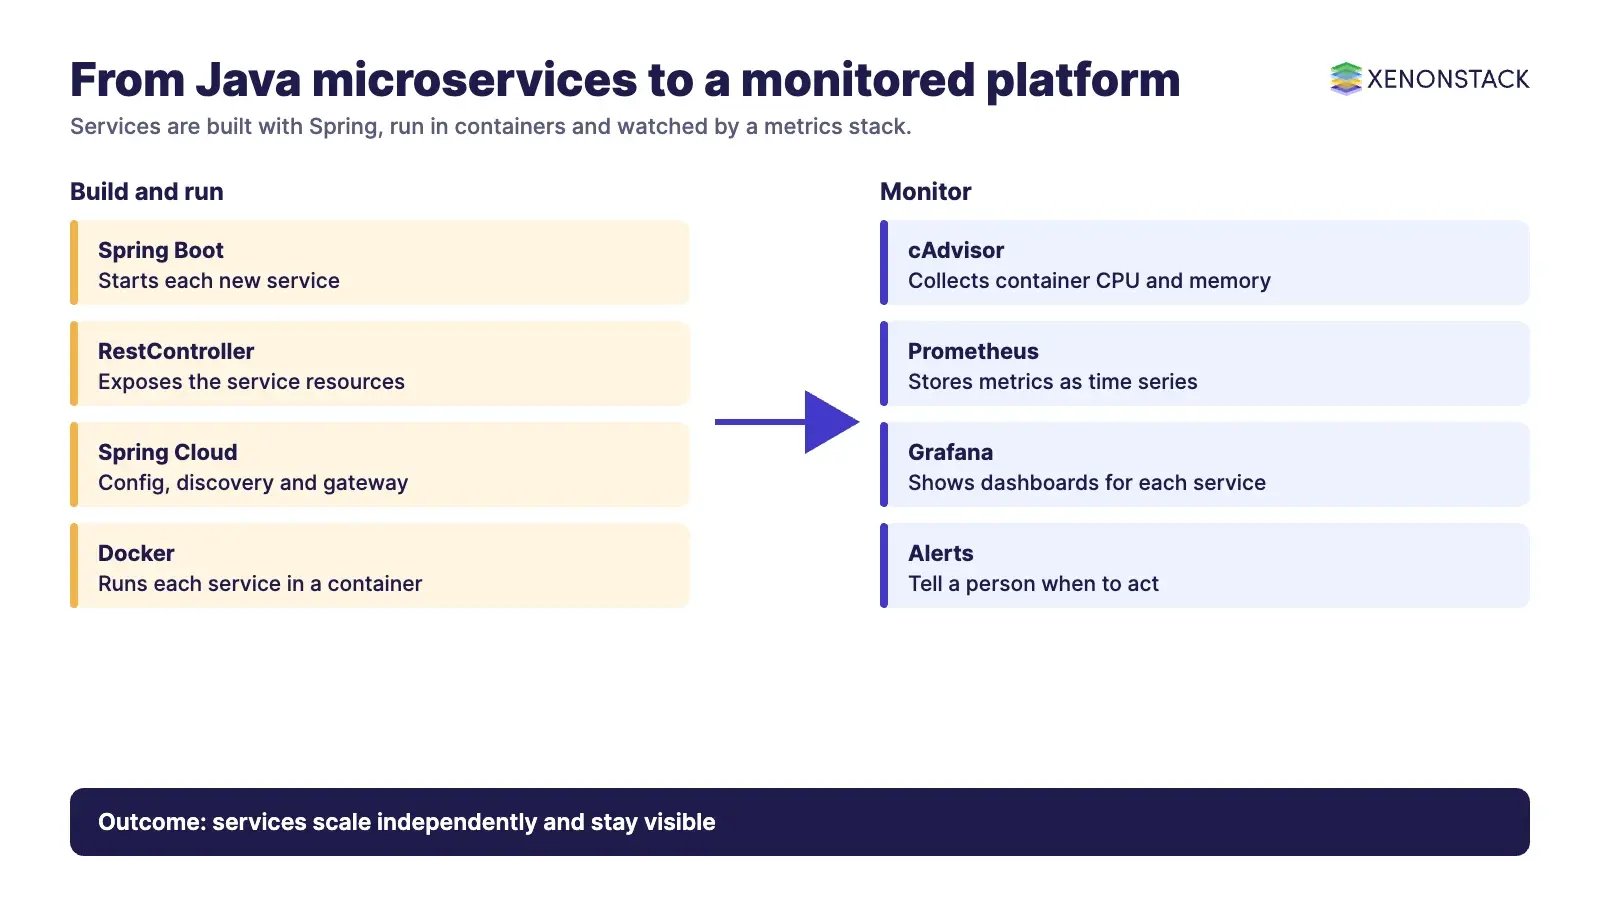
The Spring Framework is the usual way to create them. A new service starts with Spring Boot, exposes resources through a RestController and consumes remote services with RestTemplate. Services are deployed in Docker containers. The wider idea is covered in our guide to microservices architecture.
Why choose microservices over a monolith?
A monolithic application is heavy, slow to deploy, hard to test and hard to scale one part at a time. Microservices answer each of those points.
| Question | Monolith | Microservices |
|---|---|---|
| Deployment | The whole application is released together | Each service is released on its own |
| Scaling | The whole application is scaled | Only the busy service is scaled |
| Testing | Changes are tested across one large codebase | Each service is tested around its interface |
| Failure | One fault can affect everything | Failure can be isolated to one service |
| Technology | One stack for the whole application | Each service can use a suitable language |
| Operations | One thing to monitor | Many moving parts to monitor and trace |
The last row is the catch. Cloud native applications also expect applications to start, communicate and stop promptly, and running copies of a service for scale gives fault tolerance. Read traditional versus cloud native applications for how cloud native designs differ.
What does Spring Cloud add?
Spring Cloud is a set of building blocks for cloud and microservices. The Spring Cloud project page lists centralised external configuration backed by a git repository, service discovery through integrations such as Eureka, Consul and Kubernetes, a programmable gateway built on Spring Boot, and circuit breakers. It also supports platforms such as Cloud Foundry, AWS and Heroku through Spring Boot style starters. For platform choices, see our guide on PaaS and IaaS.
What makes scaling hard, and how do you monitor it?
Scaling follows the number of incoming requests. Services scale independently when they are decoupled, when failures are isolated, when delivery is continuous and when each function is treated as its own service that talks to others through inter-service communication. Monitoring is the crux of keeping this running.
The business challenge is practical. You need to analyse what metrics mean, check that your measurement system is accurate and precise, collect histograms of response time, and make monitoring available and scalable even though containers are distributed and short-lived. Following one request across services also needs distributed tracing.
- Prometheus. The Prometheus overview describes an open-source monitoring and alerting toolkit that stores metrics as time series and suits dynamic, service-oriented environments. It is not the right choice where every request must be counted exactly, such as billing.
- InfluxDB. An open-source time series database for recording metrics, events and analytics. See our note on a time series database.
- cAdvisor. An open-source tool that discovers deployed containers and collects CPU, memory, network and file system data, with a web dashboard.
- Grafana, Kibana and Elasticsearch. Dashboards and search over the metrics and logs you collect.
Where do AI agents fit?
Agents add a layer above the services, not inside them. An agent can read alerts and metrics from the monitoring stack, group related alerts, retrieve recent deployment changes and propose a fix for an engineer to approve. It should call services only through their documented interfaces and act within limits set by the platform team. ElixirClaw is the AI agents computing platform from XenonStack, and is the page to read for agent and automation use cases.
What should you check before you scale?
- Define the boundary of each service around one function and one owner.
- Set a standard for service interfaces, versioning and error handling.
- Choose how services find each other and how configuration is stored.
- Containerise with Docker and decide how containers will be managed.
- Put metrics, logs and traces in place before traffic grows.
- Decide which alerts a person must handle and which an agent may handle first.
To map one decision your operations agents make across services, and the data and policy it depends on, book a Context Workshop. See what happens in the workshop.
Frequently asked questions
What are Java microservices?
They are small, independently deployable services written in Java, usually with Spring Boot, that together form one application. Each service performs one function through a well-defined interface.
What does Spring Cloud do for microservices?
It provides building blocks such as centralised configuration, service discovery, a gateway and circuit breakers, so teams do not build these from scratch.
Why is monitoring harder with microservices?
Services are distributed, containerised and short-lived, so you need metrics, logs and traces that follow a request across many components.
What is Prometheus used for?
Prometheus is an open-source toolkit that collects metrics as time series and raises alerts, and it suits dynamic, service-oriented environments.
Can AI agents help run microservices?
Yes, as a layer above the services: an agent can triage alerts and propose fixes, while a person approves changes within limits the platform team sets.
Ready to put AI agents to work? See an ElixirClaw demo: the agentic OS to build, orchestrate and govern AI agents across your enterprise systems.
Explore the XenonStack platform family: ElixirData · ElixirClaw · ElixirHub · NexaStack · MetaSecure · Neural AI · AgentGRC · AgentSRE · AgentAnalyst · AgentInstruct · AgentRAI · AgentScrum · AgentSearch · AgentForce · AI Aviator · SAIF Aviator · CohortIQ · XenonStack AI · XenonStack UAE