Key takeaway
- See how AI predicts customer satisfaction and revenue for enterprises, and what an executive dashboard shows on acquisition cost and conversion.
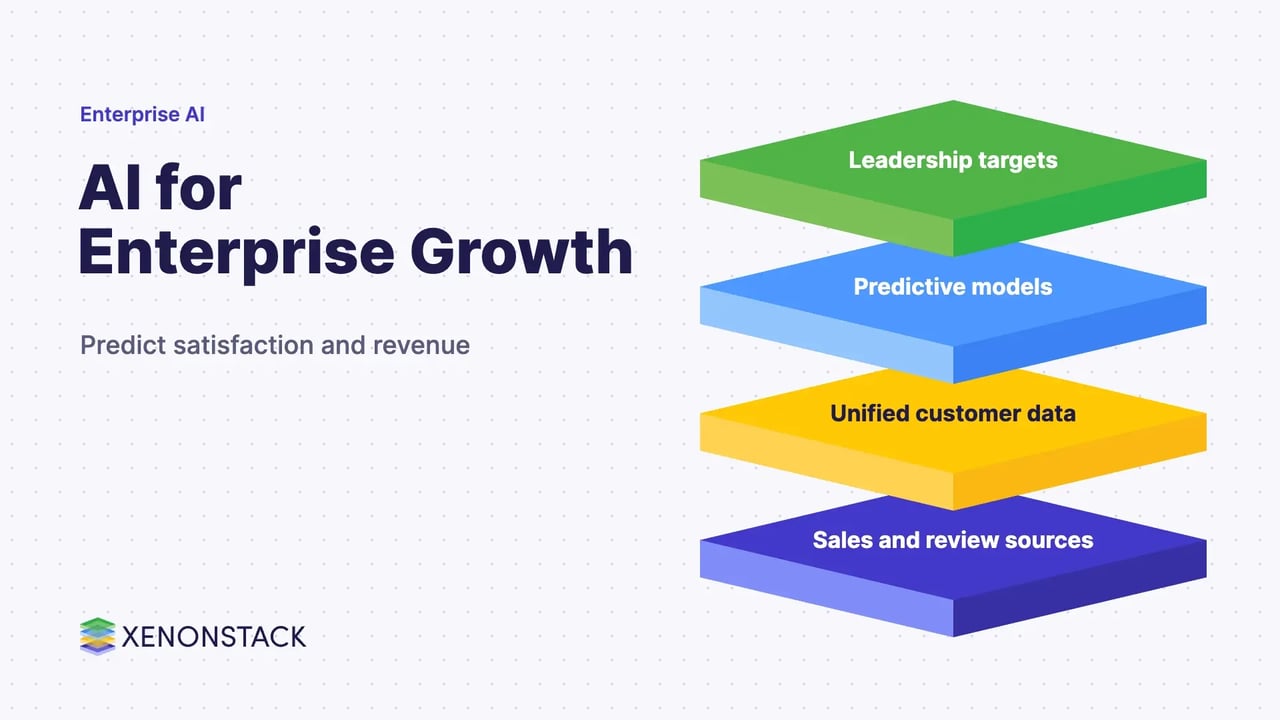
AI for enterprise technology uses predictive models on real-time customer data to forecast satisfaction and revenue, and to show whether targets will be met. Leaders gain an early view of acquisition cost, conversion and seasonal peaks. This use case shows how XenonStack approaches it, using a sample dashboard.
What are the challenges of the enterprise sector?
Customers can choose from many online sellers, so it is hard for any enterprise to meet every expectation. As technology advances, expectations rise with it, and organisations must keep adapting to win customers and protect revenue. When service falls short, staying competitive becomes difficult. To grow revenue, satisfaction and conversion, an enterprise has to deliver the best service consistently, and to know early when it is not.
How does the XenonStack solution work?
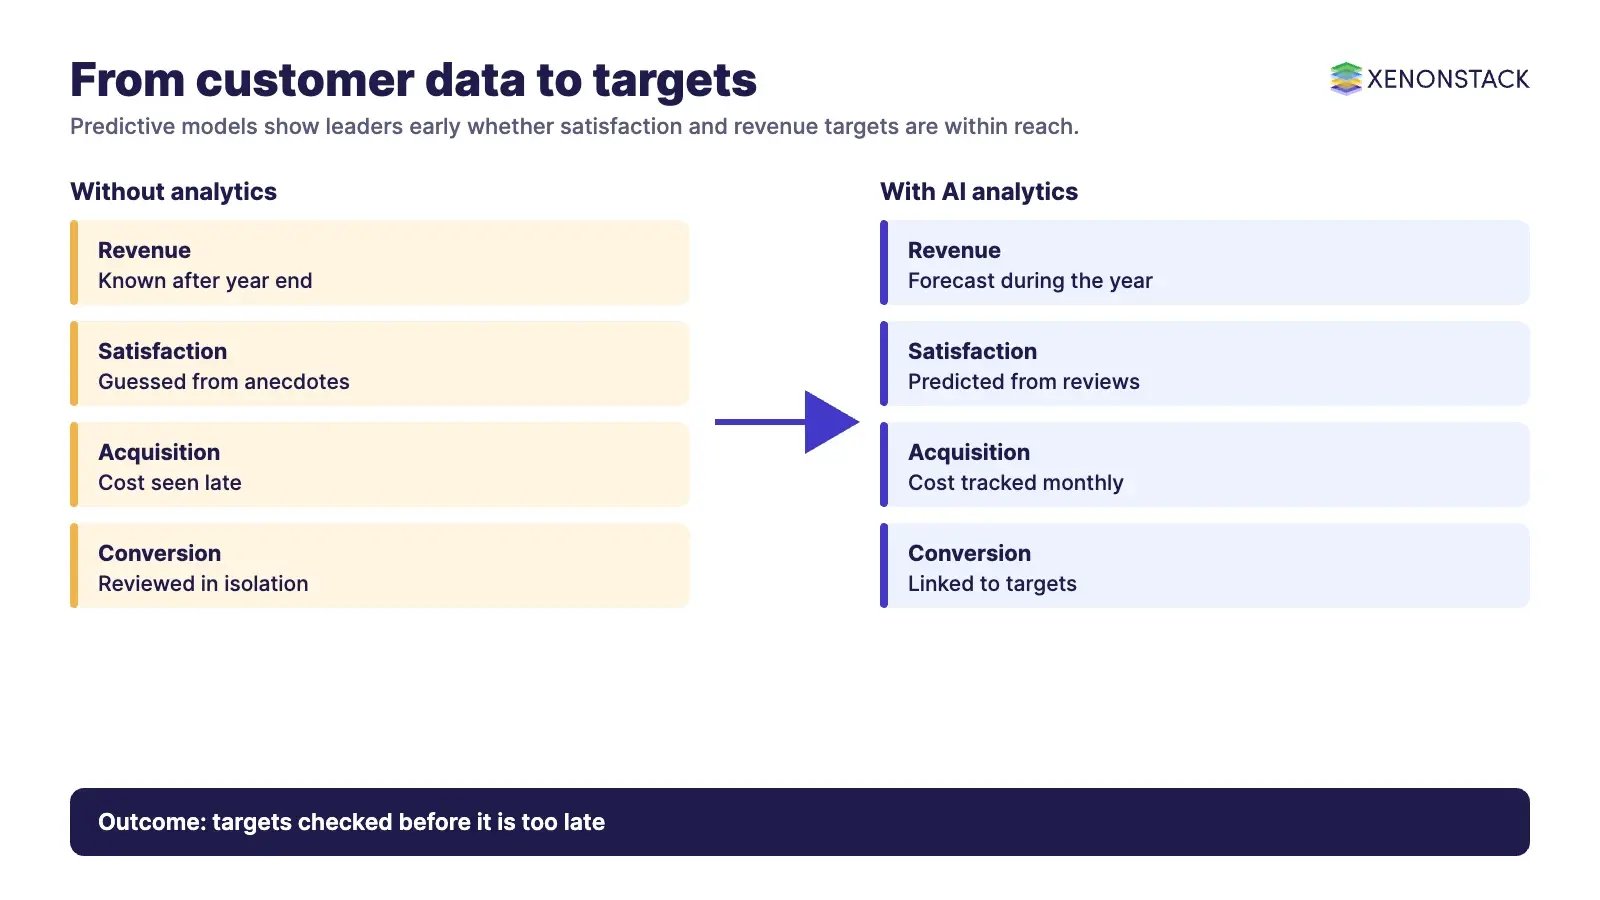
With XenonStack, an enterprise designs a predictive model on real-time data. The model forecasts customer satisfaction and the revenue likely to be generated this year. It is built from historical customer data and the reviews customers share, which also reveal customer acquisition cost and conversion rate. Our agentic analytics platform provides the layer that connects these sources.
| Component | What it does | Decision it supports |
|---|---|---|
| Revenue prediction | Forecasts revenue for the year | Target setting and budgeting |
| Satisfaction prediction | Estimates how satisfied customers are | Service improvement priorities |
| Acquisition cost view | Tracks what it costs to win a customer | Marketing spend allocation |
| Conversion view | Shows how interest turns into sales | Sales and offer design |
What does the enterprise dashboard show?
The dashboard is a sample built to show the structure of the view. Its readings are illustrative and do not describe a real business.
- Average revenue per customer across the year, which peaks in the sales periods.
- A dual line chart of acquisition cost and conversion, showing the months when acquiring customers costs least.
- Predicted revenue and customer satisfaction, so that leaders can see whether the target is within reach.
Why choose XenonStack for enterprise analytics?
XenonStack builds the model around the targets your leadership has set, then shows whether you are on course to achieve them and what share of customers are satisfied. Predictions rest on the governed context described on the ElixirData platform page, so every figure can be traced to its source.
Want to test this on your own data? Join a Context Workshop to map your sources, define the decisions and see a working view.
Frequently asked questions
What is predictive analytics for enterprise technology?
It is the use of machine learning on historical and real-time customer data to forecast outcomes such as satisfaction and revenue. Leaders use these forecasts to decide where to invest before results arrive.
How does AI predict customer satisfaction?
Models learn from past customer records and shared reviews to estimate how satisfied customers are likely to be. Teams can then fix the service gaps that matter most.
Why do customer acquisition cost and conversion rate matter?
Acquisition cost shows what it takes to win a customer, and conversion rate shows how well interest turns into sales. Together they show whether growth is efficient.
What should an enterprise AI dashboard show?
It should show revenue per customer over time, acquisition cost, conversion rate, predicted satisfaction and predicted revenue. Seasonal sales peaks should be visible so that targets are realistic.
How can we start with enterprise analytics?
Pick one target, such as predicted revenue or satisfaction, and agree the data that answers it. The Context Workshop is a short working session that maps that data and the decision it supports.
Ready to put AI agents to work? See an ElixirClaw demo: the agentic OS to build, orchestrate and govern AI agents across your enterprise systems.
Explore the XenonStack platform family: ElixirData · ElixirClaw · ElixirHub · NexaStack · MetaSecure · Neural AI · AgentGRC · AgentSRE · AgentAnalyst · AgentInstruct · AgentRAI · AgentScrum · AgentSearch · AgentForce · AI Aviator · SAIF Aviator · CohortIQ · XenonStack AI · XenonStack UAE