
.webp?width=1921&height=622&name=usecase-banner%20(1).webp)
Shining Light on Kubernetes Cost Analysis with Kubecost
As Kubernetes is becoming the leading container orchestration tool over the last couple of years, many companies are switching on it despite having a steep learning curve. When it comes to the cloud, many cloud providers are providing and helping small as well as big organizations to leverage the Kubernetes support. Companies are now transitioning their production environment on Kubernetes with cloud or on-premise infrastructure. The challenge they encounter firstly is how the Kubernetes resources are allocated accurately to the different applications, services, teams, and departments in the organization.
To understand why cost analysis of resources is important for an organization, let's go back to the time of one-to-one deployments, having a single application running on a single server and the cost of that server would be effectively the cost of that application, so there is no confusion all resources are properly allocated. But as the containers came into the picture, we are getting out of this era. Multiple pods/containers are running per server which lowers the server fleet footprint, by this cost of running the application improves and Kubernetes orchestrates those containers into logical blocks that maintain the level of abstraction which manages the low-level complexity such as the environment.
Cost Analysis in Kubernetes
Based on the different resource category
- Compute- defines the charges for the nodes.
- Storage- defines the cost of Persistent disks and EBS volumes.
- Networking- defines external traffic charges, load balancing, and so on.
And the logical components of the Kubernetes cluster are categorized as:
- Admin includes API server, etcd, scheduler and everything you can find in the Kube-system namespace.
- Monitoring includes the stack of metrics- Prometheus.
- Logging- ELK stack.
- Applications- all the pods which handle the workload of the user.
- Idle- resources like CPU, memory, network.
Based on Kubernetes objects
With Kubernetes, several new concepts have come to the container space. These include pods, services, clusters, deployment, controllers, namespaces, and many more.
- When we talk about the cluster, it is like a pool of resources together from multiple cloud Virtual Machines or Bare metal machines called nodes in Kubernetes. Analyzing costs at the cluster level can be useful.
- After that, Kubernetes services by grouping these together define a policy by which pods can be accessed. Tracking the services gives us the analysis of a set of pods.
- Pods and containers are the smallest deployable unit in Kubernetes. Containers can be defined as the bis building block of applications. As Kubernetes called the container orchestration, it allows us to allocate resources to the container using resource limits and requests.
- Namespaces in Kubernetes are providing a way to divide the cluster into different logical clusters. These logical clusters are allocated to the specific teams or departments in an organization. When starting to analyze the Kubernetes resources, namespaces are a good starting point for cost analysis.
 Kubecost - Open Source model
Kubecost models give teams visibility into current and enterprise data management strategy historical Kubernetes spending and resource allocation. These models provide cost transparency in Kubernetes environments that support multiple applications, teams, departments, etc. Some features provided by Kubecost:
- Real-time cost allocation for native Kubernetes concepts: service, deployment, namespace, label, daemonset, pod, container, and more
- Dynamic asset pricing enabled by integrations with AWS, Azure, and GCP billing APIs
- Supports on-prem k8s clusters with custom pricing sheets
- Allocation for in-cluster resources like CPU, GPU, memory, and persistent volumes.
- Allocation for AWS & GCP out-of-cluster resources like RDS instances and S3 buckets with a key.
- Easily export pricing data to Prometheus with /metrics endpoint
- Free and open-source distribution (Apache2 license)
The requirements for this tool:
- Kubernetes – 1.8 or higher
- Kube-state-metrics
- Node exporter
- Prometheus
- Grafana
Gathering the data
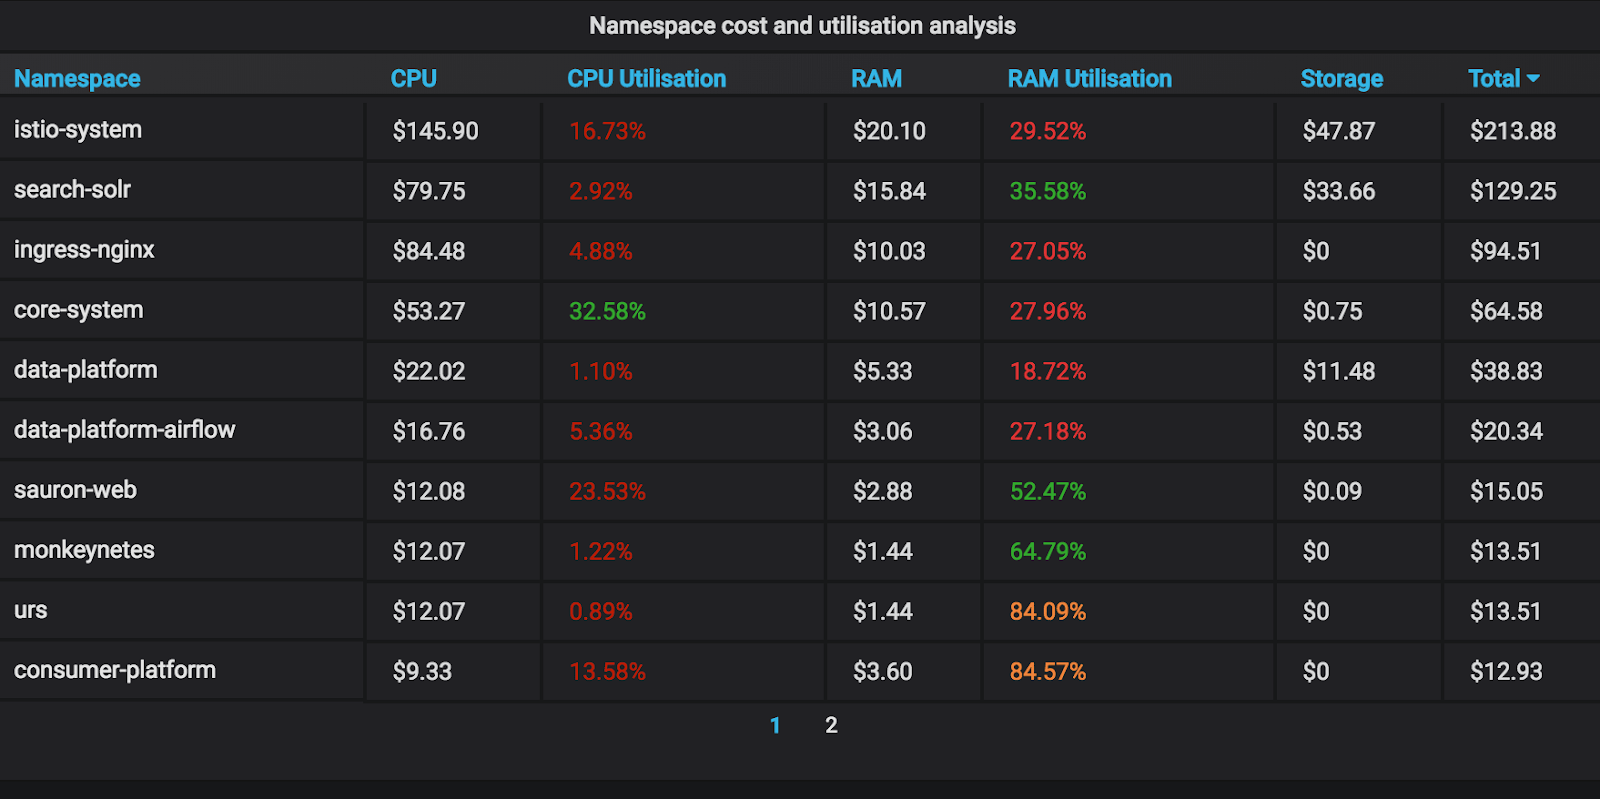
For the cost analysis of Kubernetes resources, we need metrics exposed from our Kube cluster and a time-series database to gather the metrics, and a tool to visualize those metrics graphically. Here we deploy Kube-state-metrics onto our Kubernetes cluster which generates metrics like “kube_pod_container_cpu_usage” for our pods. “Prometheus” is our time-series database for gathering the metrics and “Grafana” as our visualization tool. After this, we can aggregate based on namespaces, nodes, and so on to visualize on the dashboard. We can scrape the Kube-state-metrics with Prometheus config like:
scrape_configs:
job_name: 'kubernetes-service-endpoints'
kubernetes_sd_configs:
role: endpoints
job_name: prometheus
static_configs:
targets:
localhost:9090
Deploying as a pod
We can deploy the cost model (w/o dashboards) directly to a pod on your cluster, and complete the list below.
- Git clone the official repository of Kubecost.
- Set this environment variable to the address of your Prometheus server like this:
env:
- name: PROMETHEUS_SERVER_ENDPOINT
value: "" #The endpoint should have the form https://<service-name>.<namespace-name>.svc.cluster.local
kubectl create namespace cost-model
kubectl apply -f kubernetes/ --namespace cost-modelkubectl port-forward --namespace cost-model service/cost-model 9003
To test that the server is running, you can hit http://localhost:9003/costDataModel?timeWindow=1d
Conclusion
Various optimizations are there that can reduce the Kubernetes resource costs. One of the ways, with monitoring. Many organizations reduce their infrastructure costs by +30%, which is the best starting point to determine the return on investment of different cost reduction operations. Through this blog, you can see a Grafana dashboard that gives you visibility into your key cost parameters like CPU, memory, network, and storage. Soon in the future, more detailed analysis and targeted actions can help reduce your Kubernetes costs after monitoring is in place.


