Key takeaway
- LLM observability explained for enterprise leaders: what to trace, which tools to use in 2027, how to evaluate and govern LLMs and agents in production.
LLM observability is the practice of capturing every request to a model as a trace (prompt, retrieved context, tool calls, response, tokens, latency and cost), scoring those traces for quality and safety, and alerting when behaviour drifts. Classic monitoring tells you the service is up. LLM observability tells you whether the answer was right, grounded and allowed. It builds on the metrics, logs and traces of general observability, adds evaluation, and applies to large language models and the agents built on them.
For enterprise leaders the decision is not which dashboard to buy. It is whether each production LLM call can be reconstructed afterwards: what was asked, what the model saw, what it did and under which policy. Tracing records what happened. The governance layer records why it was allowed, which is the gap covered in AI agent decision tracing vs telemetry. This guide sets out what to capture, how the tooling landscape looks in 2026, and the order in which to adopt it.
What is LLM observability and how does it differ from monitoring?
Monitoring watches known signals such as uptime, error rate and latency. Observability lets you ask new questions of a running system from the data it emits. For an LLM application the failure is often silent: the service returns HTTP 200 with a fluent but wrong or unsafe answer. That is why traces and evaluation scores sit beside the usual three signals.
| Layer | What you capture | Question it answers |
|---|---|---|
| Metrics | Latency, error rate, token usage, cost per request | Is it fast, stable and affordable? |
| Logs | Prompts, responses, errors, guardrail hits | What exactly happened on this request? |
| Traces | Each step: retrieval, model call, tool call, sub-agent | Where did the time, cost or error come from? |
| Evaluations | Scores from LLM judges, code checks and human labels | Was the answer correct, grounded and safe? |
| Decision records | Policy applied, approver, evidence used | Was the action allowed, and can we prove it? |
Which signals should an enterprise capture for every LLM call?
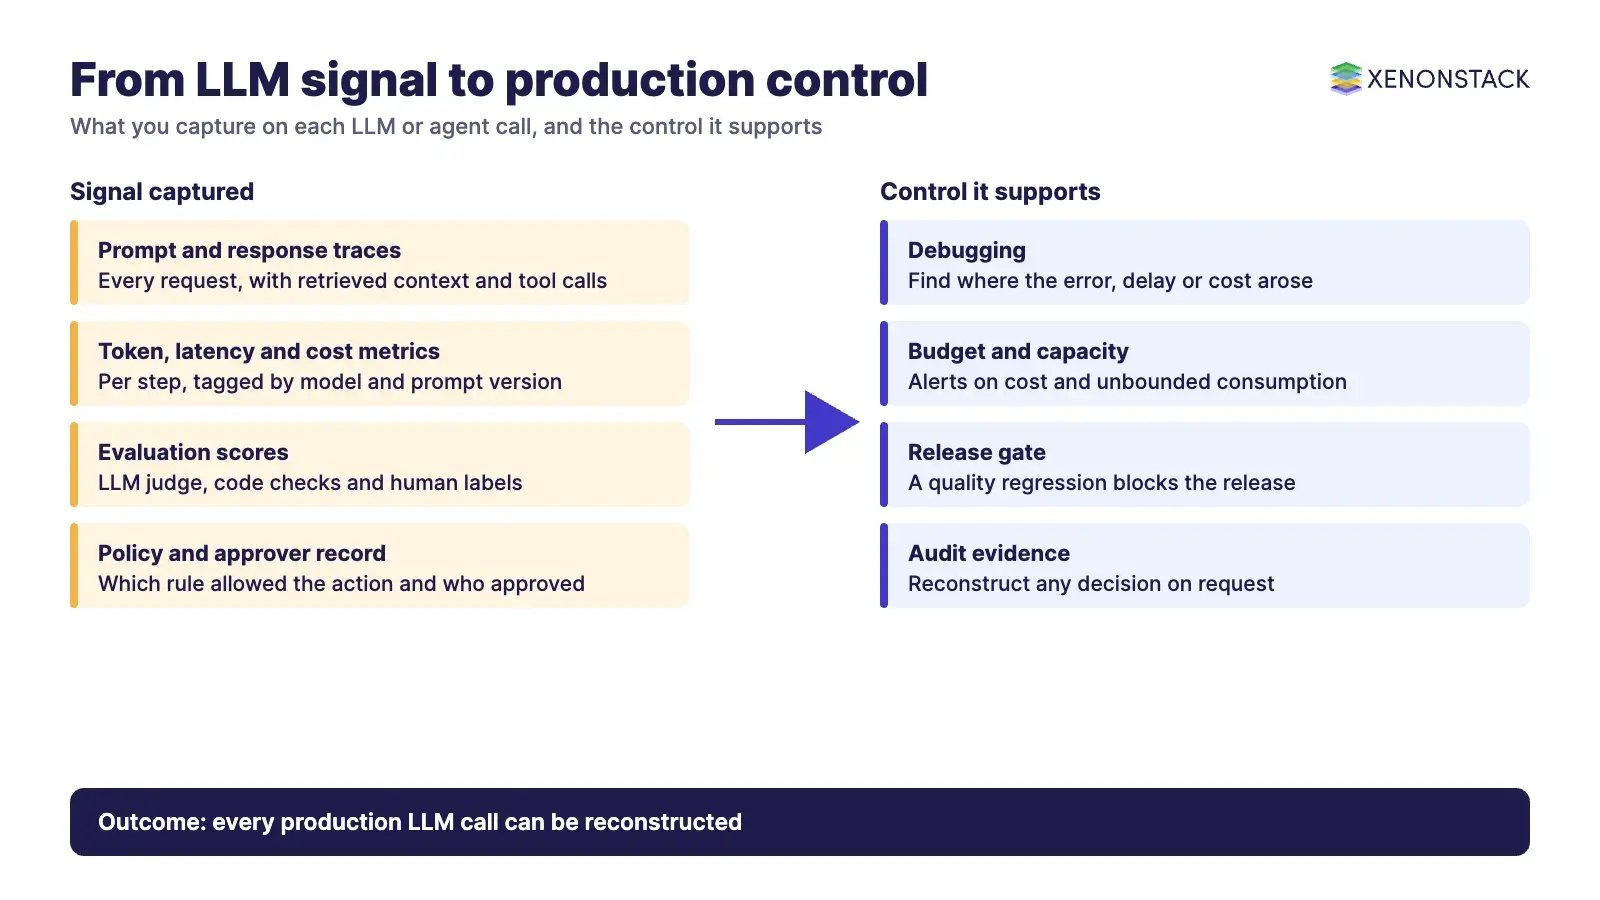
Langfuse describes application tracing as structured logs of every request that capture the exact prompt sent, the model response, token usage, latency and the intermediate tool or retrieval steps (Langfuse docs, read 12 Nov 2026). That is a sound minimum. In practice we group the signals into four sets.
Operational signals
Latency per step, error counts, token usage and cost per request, tagged by model, prompt version and application. These feed the budget and capacity conversation and are the easiest to alert on.
Quality signals
Scores for correctness, groundedness against retrieved sources, relevance and format. Langfuse lists LLM-as-a-judge evaluation, datasets and experiments among its features, and Arize Phoenix describes scoring with LLM-based evaluators, code-based checks or human labels. Treat judge scores as a signal to be sampled and checked by people, not as ground truth.
Safety and security signals
Prompt-injection attempts, sensitive data in prompts or outputs, and agents acting beyond their remit. The OWASP Top 10 for LLM Applications 2025 is a useful checklist here: it names Prompt Injection, Sensitive Information Disclosure, Excessive Agency, System Prompt Leakage, Misinformation and Unbounded Consumption among its ten risks (OWASP GenAI Security Project, read 12 Nov 2026). Several of these only show up if you log tool calls and outputs.
Behavioural drift signals
Shifts in input topics, answer length, refusal rate, retrieval hit rate or score distribution. Statistical or ML-based anomaly detection on these series catches a bad prompt change or a model update before users report it. A sudden jump in error rate or drop in groundedness is the pattern to alert on.
Which LLM observability tools should you consider going into 2027?
The market has consolidated around open standards. The table below uses each vendor or project's own documentation; check licensing and hosting terms before you commit.
| Tool | What its own docs say | When it fits | Status |
|---|---|---|---|
| Langfuse | Traces, scores, LLM-as-a-judge, prompt management, datasets and experiments; open source and self-hostable | Teams that want open-source tracing and evaluation on their own infrastructure | Active |
| Arize Phoenix | Tracing over OpenTelemetry (OTLP), built on OpenInference, with evaluators, datasets, experiments and a prompt playground; Arize AX is the separate managed platform | Teams standardising on OpenTelemetry who want evaluation beside traces | Active |
| MLflow Tracing | Described as fully OpenTelemetry-compatible, with one-line auto-instrumentation for frameworks such as OpenAI and LangChain, async logging and sampling | Teams already running MLflow for the model lifecycle | Active |
| WhyLabs | Its site states WhyLabs, Inc. is discontinuing operations and that the platform has been open sourced | Do not start a new commercial dependency; review the open-source repositories if you have existing use | Discontinued (company) |
If you use WhyLabs today, plan a migration deliberately. Prefer tools that emit and ingest OpenTelemetry so traces can move between backends.
Is there an open standard for LLM traces?
Yes, in progress. OpenTelemetry maintains semantic conventions for generative AI covering spans, metrics and events for GenAI clients, MCP (Model Context Protocol) and provider-specific conventions. The documentation has moved to the open-telemetry/semantic-conventions-genai repository, and its page does not state a maturity level, so check the repository for the current status before you depend on attribute names.
How do you observe agents and not just single LLM calls?
Agents plan, call tools and hand work to other agents, so one user request becomes a tree of spans. Observability for agents needs the full tree: each retrieval, tool call with its arguments, and the model output that triggered it. Our own AgentOps work with enterprise teams follows the same pattern: put an LLM gateway and guardrails in front of the models, then run online evaluation jobs with alert thresholds on top of the traces before promoting a workflow to production. Evaluation of agent accuracy, safety and reliability is the focus of AgentEvaluation, which sits well beside tracing.
Traces still stop short of accountability. They show that an agent issued a refund; they do not show which policy allowed it or who approved it. ElixirData Context OS keeps governed context, versioned policy and decision traces in one decision layer above AI agents, and the Decision Review Agent reviews AI decisions before execution, routes to the right approver and stores decision lineage.
What does governance require from your LLM logs?
Logs become a compliance asset once a regulator or auditor asks for them. Article 12 of the EU AI Act states that high-risk AI systems shall technically allow for the automatic recording of events (logs) over the lifetime of the system (EU AI Act Service Desk, read 12 Nov 2026). Whether your system is high-risk is a legal question, so confirm it with counsel.
| Concern | Control to build into observability |
|---|---|
| Personal data in prompts | Redact or hash before storage; set retention periods; restrict who can read raw traces |
| Audit evidence | Immutable trace storage with prompt version, model version and policy version on each record |
| Cost runaway | Per-team token budgets and alerts on unbounded consumption |
| Unsafe outputs | Guardrail hit counts, review queues and sampled human review |
| Vendor lock-in | Emit OpenTelemetry-compatible traces and keep export rights |
What are the challenges and trade-offs of LLM observability?
Storing full prompts and responses raises cost and privacy exposure, so sample routine traffic and keep every trace for flagged or high-risk requests. No single universal quality metric exists; teams define task-specific scores such as groundedness for retrieval-based assistants and exact-match for structured extraction. LLM judges are themselves models and can be wrong or biased, so calibrate them against human labels. Finally, skills matter: someone must own evaluation datasets, thresholds and incident response, or the dashboards go unread.
When not to invest heavily: a low-risk internal prototype with a handful of users needs request logging and cost tracking, not a full evaluation pipeline. Add depth as the use case gains users, access to sensitive data or the ability to act.
In what order should you adopt LLM observability?
| Stage | Action | Exit test |
|---|---|---|
| 1. Instrument | Trace every LLM and tool call with prompt, model and version tags | Every production call appears in one trace store |
| 2. Measure | Track latency, tokens and cost per request | Cost per use case is visible weekly |
| 3. Evaluate | Build a dataset from real traces; add judge and code-based checks | A regression fails a release gate |
| 4. Alert | Set thresholds on quality, safety and drift | Incidents are caught by alerts, not by users |
| 5. Govern | Attach policy, approver and evidence to high-risk actions | Any decision can be reconstructed on request |
Watch: what LLMs can do for the enterprise
XenonStack video: how LLM capabilities can transform enterprises, the context for why production LLMs need observability.
To map one decision your LLM or agents make in production, and the context and policy it depends on, book a Context Workshop. See what happens in the workshop.
What should you plan for in 2027?
The Council of the EU page on the AI omnibus sets the dates that matter for logging and audit evidence. Confirm with counsel whether your system is high-risk.
- 2 December 2027: the date the Council gives for stand-alone high-risk AI systems. Council timeline
- 2 August 2028: the date the same page gives for high-risk AI systems embedded in products.
- Now: instrument every production call, keep prompt, model and policy versions on each trace, and agree retention periods, so that logs can serve as evidence when the dates arrive.
Frequently asked questions
What is LLM observability?
It is the practice of capturing traces of every LLM request, including prompts, retrieved context, tool calls, responses, tokens and latency, scoring them for quality and safety, and alerting on drift.
How is LLM observability different from ML monitoring?
Classic ML monitoring tracks data drift and prediction metrics. LLM observability adds prompt and response traces, step-level agent spans and evaluation of free-text output, because failures are often fluent but wrong.
Is there an open standard for LLM traces?
OpenTelemetry maintains GenAI semantic conventions for spans, metrics and events, now hosted in the open-telemetry/semantic-conventions-genai repository. Check that repository for its current maturity.
Which tools can I use?
Langfuse, Arize Phoenix and MLflow Tracing each document open-source or OpenTelemetry-compatible tracing. WhyLabs has announced it is discontinuing operations, so avoid new commercial dependence on it.
Do LLM logs matter for compliance?
They can. Article 12 of the EU AI Act requires high-risk AI systems to technically allow automatic recording of events over their lifetime. Confirm with counsel whether your system is high-risk.
Where does decision tracing fit?
Traces show what an agent did. Decision traces add the policy, evidence and approver behind each action, which auditors need and observability tools alone do not provide.
Follow XenonStack on LinkedIn: XenonStack on LinkedIn for new guides on agentic AI, data and platform engineering.
Ready to put AI agents to work? Explore ElixirClaw, the agentic OS platform to build, orchestrate and govern AI agents.
Explore the XenonStack platform family: ElixirData · ElixirClaw · ElixirHub · NexaStack · MetaSecure · Neural AI · AgentGRC · AgentSRE · AgentAnalyst · AgentInstruct · AgentRAI · AgentScrum · AgentSearch · AgentForce · AI Aviator · SAIF Aviator · CohortIQ · XenonStack AI · XenonStack UAE