
.webp?width=1921&height=622&name=usecase-banner%20(1).webp)
Introduction to Data Storytelling
As data analytics is gaining its importance in the market due to the rich information generated by it, the importance of taking suitable actions based on the insights gained is the ultimate goal. For this, the foremost requirement is for business people who will decide they need to communicate complex insights to fully understand the whole story behind and ahead of the analysis. This is where the actual gap comes in the market.
Crafting a story around the analysis done is the most effective way to communicate, and visuals are the most accessible medium for our brain to comprehend things. This is where the term data storytelling emerges as the next chapter of the data analysis.
What is Data Storytelling?
In the simplest terms, the ability to communicate rich information as narrative stories in the simplest terms. It involved creating a story out of the findings done through data analysis to allow the laymen to comprehend the complex insights so that the final understanding of it can be applied to make some business decisions or can be transformed into some valuable actions.
Importance of the Data Storytelling
Data storytelling is important because a person who needs to understand the insights need not be familiar with the special skills to comprehend the complex data analysis. This way, the heavy and complex analysis, which took so much effort and time, can easily be communicated. Data Storytelling is realizing the great skill of data visualization. Data insights are potentially useless if not communicated to the right people in the right manner.
Additionally, rather than hard numbers, it is easier to memorize the stories and retain them for a long.
For creating a long-lasting impact on your audience, you can always go to storytelling. Studies show that recall the facts up to 22 times more effective when they are part of the story compared to when they are presented as isolated data points. The information presented in the form of a story also reinforces our understanding and decipher patterns in the complex data sets.
Data quality evaluates the state of your data by considering elements like accuracy, consistency, and integrity.Click to Explore Data Quality and its Challenges
Who Benefits from the Data Storytelling?
As discussed, Data Storytelling is the process of taking raw data, analyzing it, and communicating its significance. If the whole team is involved right from collecting the data and processing it and analyzing it and the actions taken on this, for that implementation, there will be a technical team, then who needs to be told the story?
The Decision-Makers, the Clients
They are the ones to whom the significance of the whole complex work done on the analysis needs to be floated. The main showdown of the analysis is making some business decisions and taking actions that help resolve real-world problems from the data that is of no use. But the whole point boils down to the decision-makers actions on the analysis. If they understand the significance of the data, then who knows what miracles can be done.
The Marketers
As the companies start or create the data analysis reports they hardly make it into marketers’ hands. Even when these reports do, marketers are often ill-skilled to work through the data and make great stories out of it. Resultantly, a significant amount of valuable data becomes useless. This is unfortunate if this much effort doesn’t reach its climax as brands communicate to their target audience using this powerful tool named data storytelling.
Data processing's importance includes better decisions, higher productivity and profits, and more accurate and dependable data.Read more about Composable Data Processing with a Case study
What are the Benefits of Data Storytelling?
Different people benefit from Data Storytelling:-
The Decision-Makers
Learn about your own business game
The company you run on your own, no matter how proactive you are, will always be something new to learn about your company. Do you have an idea of what your company’s pipeline is day by day? A business that you have closed, what is the number? What is the number of your current leads? How satisfied are your employees? What’s the downtime rate of your official website? Data storytelling brings all the distributed information from all parts to in a way anyone can understand, this day, every day.
Better and Faster Decisions
When you understand your business intimately, you would not stress about what should be your next step. Since the data will be in front of you, you need to get going on it, making your decisions faster, which means you can be more confident, and hence you can move faster and crush your goal.
Powerful Competitor Analysis Model
In a highly competitive market, everybody is at risk of losing potential customers to the competition. To stand out, you would want to identify competitive data insights from your campaigns and operations. Your internal data can be used to tell a story about your brand’s personality and its unique strategies, which you would sell as a solution to solve the problems of your target customers.
For a Data Analyst
Boost Client Communication and Engagement
To maintain long-term relationships with clients, it's important to keep engaged with clients regarding strategies to be adopted for the solutions and collect and analyze the data. For building effective client communication with clients in every manner like compiling information into a presentation, data storytelling can save you when it comes to effectively conveying the results and demonstrating the value of your services.
Created Visual Appeal
As a human tendency is to have an ever-shrinking attention span, data visualizations can be useful tools that can go a long way in communicating the needful. The usage of graphs, charts, heat maps, and more can be boiled down to creating visual appeal to the end customer. Clients want to know the success story behind the results, not just the hard numbers. Combining the elements of data, knowledge, information, and insights into a visual format can be incredibly valuable in reporting to clients.
Key to Data Science
Storytelling is somewhere a part of human nature in one way or the other. Storytelling has long been one of the most important mediums to teach, influence, and inspire an audience. If talking about data science, after we collect, clean, and analyze data, what comes next is to relay context using a compelling narrative and visuals that can help the end-user grasp the data's importance.
A big data architecture is intended to handle data ingestion, processing, and analysis that is too large or complex for traditional database systems.Click to explore Top 9 Challenges of Big Data Architecture
Implementation of Data Storytelling
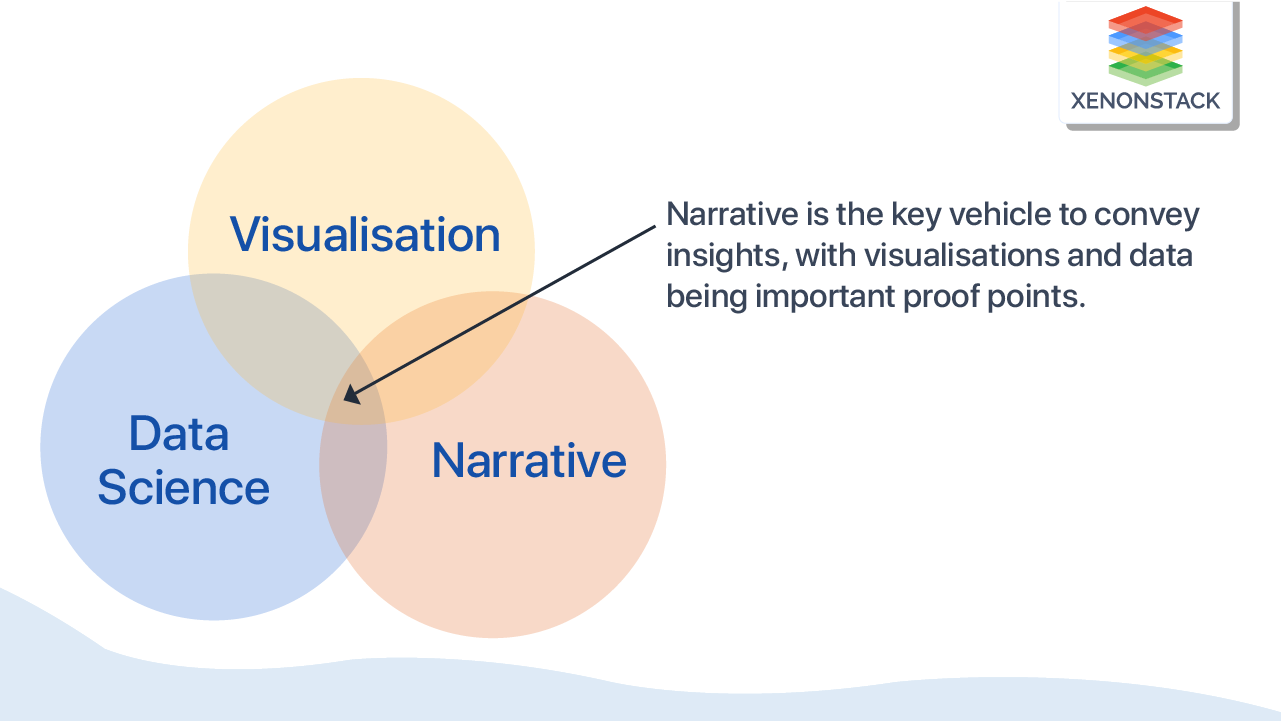
Data Storytelling revolves around three things: data, narrative, and visuals, as these three work together to impact the audience. So these are the points on which the storyteller needs to focus on. How these work together is explained below-
Explain: Coupling a narrative with insights allows you to explain what's happening with the data and why certain metrics and KPIs are important to the overall trend.
Enlighten: By using data visualization, you can enlighten the audience of key patterns, trends, and outliers that may have otherwise been missed.
Engage: Finally, by pairing visuals with a narrative, you create an engaging story that can drive change at the organization.
Remember, data storytelling is important because it increases the memorability, persuasiveness, and engagement of data insights.
Example of Story about the Data Storytelling
The best to tell your data story is to visualize it to be grasped by a wider audience. This medium binds all of the ideas we’ve mentioned so far.
Here are two strikingly different but equally powerful visuals used for building a compelling narrative with your insightful data to give an example of the power of storytelling with data visualization.
Employee Performance Dashboard Example
Featured KPIs:
-
Overtime Hours
-
Employee Productivity
-
Absenteeism Rate
-
Training Costs
Primarily this is an example to streamline the busy HR department. It can be called an HR dashboard that focuses on employee performance key features with a mix of KPIs that build a comprehensive profile around training costs, employee attendance rate, productivity, and overtime hours.
Use of some other dynamic visuals like a mix of charts, graphs, and graphical information by utilizing HR analytics tools can be used to build an effective narrative relating to an employee's performance over a period of time. It creates a compelling plot that can increase productivity and enhance the company's economic efficiency and support strategies in boosting staff engagement.
This dashboard is a source of an abundance of useful insights. When insights are coupled with the data visualization used with HR work, the possibilities can be endless. Data storytelling can achieve a milestone from creating effective HR reports to obtaining a bird-eye view of the whole HR development and processes.
Conclusion
Marrying data analytics with good storytelling has multiple advantages. It helps in removing the noise and focusing on the people’s attention on the key insights. This skill is a go-to for data analysts because they would not want to make their hard work reach its climax. Since the relation between features and data can not be depicted, the data storytelling will come with stories and visuals to save you.


