Key takeaway
- How analytics helps a real estate developer compare properties, find trending locations and decide how many units to build, keep or sell to improve ROI.
Analytics for real estate development is the use of property, price and demand data to decide where to build, how many units to build and how many to keep or sell, so that an investment pays back within its planned time. It replaces guesswork about location and unit mix with a comparison the investor can inspect.
This page is for property investors and developers. It covers the problem, how the analysis works, where AI agents fit, a comparison with planning by instinct and what to check before adopting.
What problem do real estate investors face when planning development?
An investor finds it hard to compare all the properties in a market and to spot the trending location for development. They are also unsure how many units to build in a single building so that the investment pays back in the planned time. Wikipedia describes development as acquiring land or property, improving it through planning and construction, and selling or leasing it, with developers carrying significant financial risk. It also notes that projects can run a long time without cash flow and that borrowing increases both return and risk, which is why the unit and location decisions matter.
How does development analytics work?
A development plan made on time, in line with demand and market conditions, helps maximise the investor's return on investment. The analysis is built to answer three questions.
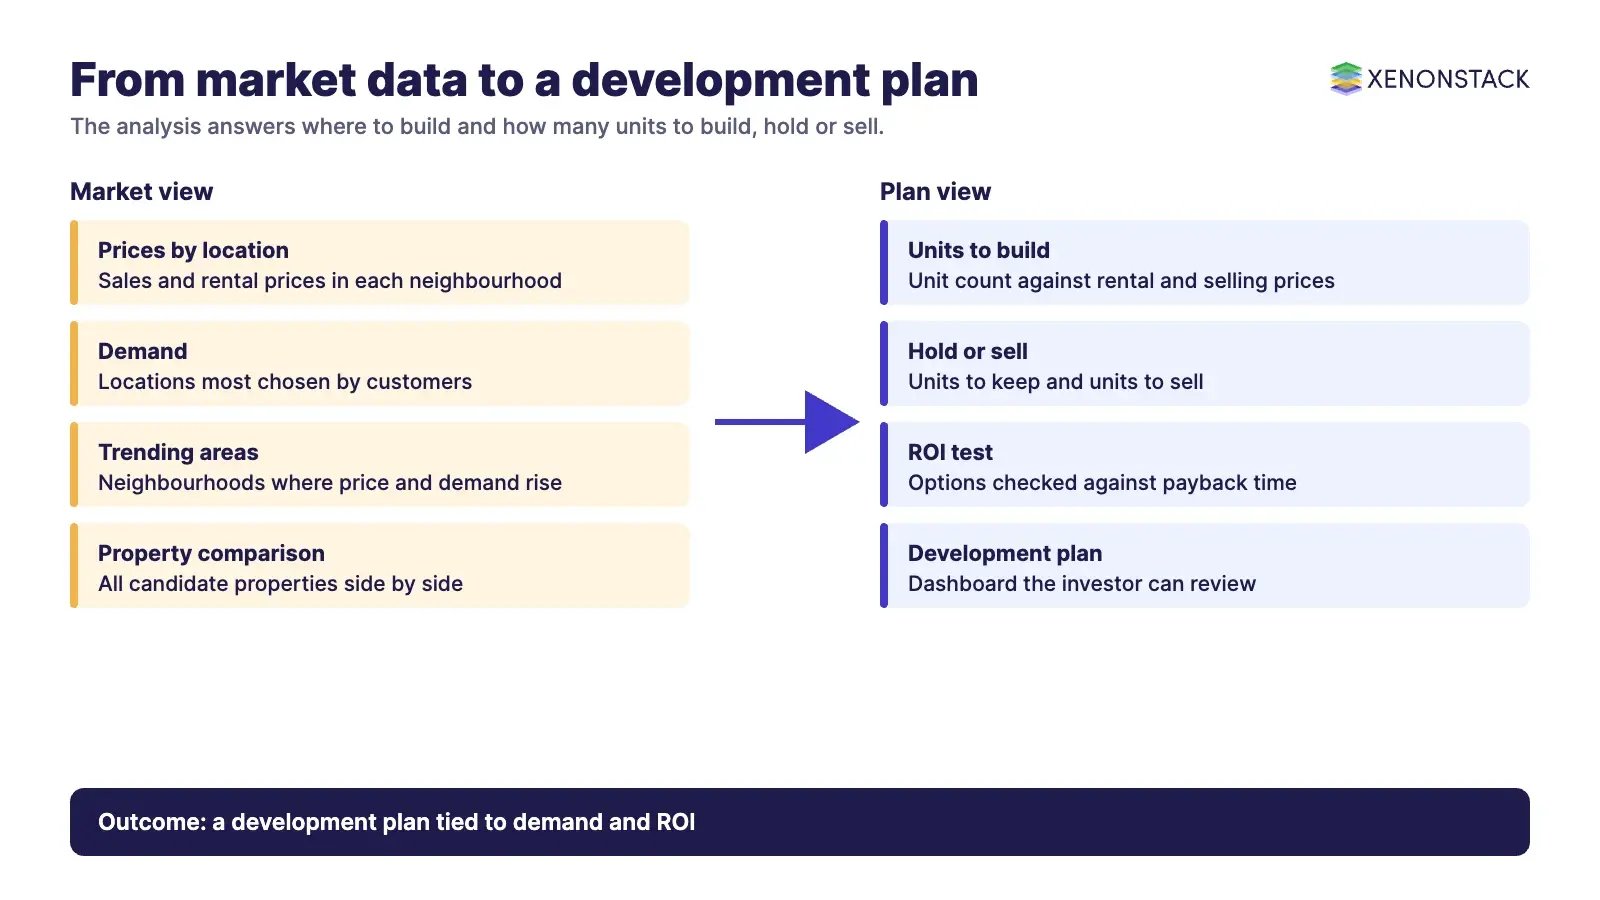
- What is the trending neighbourhood for development?
- How many units should be built to maximise ROI?
- How many units should be held, and how many sold, to maximise ROI?
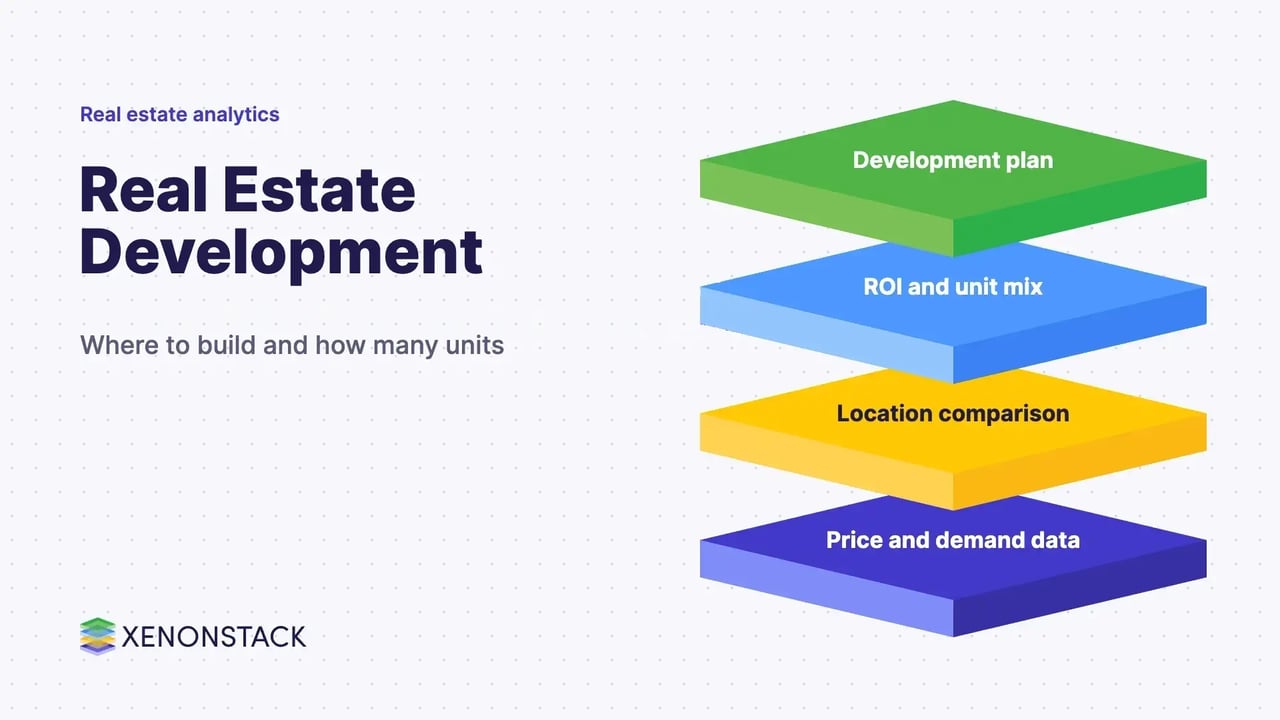
- Gather prices, rents, sales volumes and unit counts for properties across candidate locations.
- Compare locations on the prices buyers pay and on how often they choose them.
- Relate the number of units in a property to rental and selling prices.
- Show the result on a development plan dashboard so the investor can test options.
What does the development plan dashboard show?
Some locations attract the highest prices, while others are chosen by the most people. An investor who wants higher income or more customers can build in the location that customers choose more and pay more for. The dashboard also shows the number of units to build in different properties against their rental and selling prices. The value for the investor is a view of the most trending locations with their sales prices, and an indication of how many units to build or keep so the investment is recovered.
Where do AI agents fit in development planning?
Agents can gather fresh listings and sales for candidate locations, rerun the comparison when new data arrives, and prepare a short briefing on which locations and unit mixes have moved. Spatial tools that model population trends and the demographics of likely buyers or tenants are one input that can reduce risk. Each recommendation should show the data behind it. ElixirData is XenonStack's Context OS for data and governance, and ElixirClaw is its AI agents computing platform.
How does analytics-led planning compare with planning by instinct?
| Decision | Planning by instinct | Analytics-led planning |
|---|---|---|
| Location | Choose a familiar neighbourhood | Compare locations on price paid and demand |
| Units to build | Build to the plot | Relate unit count to rental and selling prices |
| Hold or sell | Decided late | Tested against ROI before building |
| Timing | Follows the last project | Follows demand and market conditions |
What should you check before adopting development analytics?
- Data coverage: confirm the dashboard covers the locations and property types you are considering.
- Freshness: market conditions change, so check how often the data is refreshed.
- Assumptions: make the ROI assumptions, including rents, sale prices and holding time, visible.
- Other factors: approvals, infrastructure and financing sit outside the dashboard and still need review.
- Ownership: decide who signs off a development plan.
XenonStack provides an analysis report that shows the most trending locations, where customers can pay higher prices, so investors can choose the location customers are most likely to prefer.
To map one decision your agents make, and the data and policy it depends on, book a Context Workshop. See what happens in the workshop.
Frequently asked questions
What is real estate development analytics?
It is the use of property, price and demand data to decide where to build, how many units to build and how many to hold or sell so that the investment pays back.
How does analytics identify a trending location?
It compares locations on the prices buyers pay and on how many buyers choose them, so the investor can see where demand and price are both high.
How many units should a developer build?
It depends on the rental and selling prices in the location. The analysis relates unit count to those prices so the investor can test options against ROI.
What risks does development carry?
Projects depend on approvals and infrastructure, can run for long periods without cash flow and carry more risk when financed by borrowing.
Can a dashboard replace a feasibility study?
No. It supports location and unit decisions with data, while approvals, construction and financing need their own review.
Ready to put AI agents to work? See an ElixirClaw demo: the agentic OS to build, orchestrate and govern AI agents across your enterprise systems.
Explore the XenonStack platform family: ElixirData · ElixirClaw · ElixirHub · NexaStack · MetaSecure · Neural AI · AgentGRC · AgentSRE · AgentAnalyst · AgentInstruct · AgentRAI · AgentScrum · AgentSearch · AgentForce · AI Aviator · SAIF Aviator · CohortIQ · XenonStack AI · XenonStack UAE