Key takeaway
- A machine learning platform for consumer technology predicts days to sell, turnover and stock by category. See how it works and what to check first.
A machine learning platform for the consumer technology industry is an analytics system that learns from sales, stock and supply chain data to show the status of sold products and predict how long items take to sell and what turnover to expect. It gives category, inventory and finance teams one place to see trends and forecasts instead of assembling them by hand.
This page is for retail, distribution and product teams in consumer technology. It covers what these teams need, how the platform works, how it compares with spreadsheet reporting, where AI agents fit and what to settle before you start.
What do consumer technology businesses need from analytics?
The sector's pressures are familiar: the cost of carrying stock by category, real-time support across channels for the customer journey, anticipating what customers will want, automated processing and first-enquiry resolution. Stakeholders also expect year-over-year trend analysis for each category and for inventory, and a monthly growth view set against the turnover of the previous year before anyone draws a conclusion.
Reports built by hand are slow to refresh and hard to compare across categories. A machine learning platform is meant to keep those views current and add a forward-looking layer on top of them.
How does an ML analytics platform work?
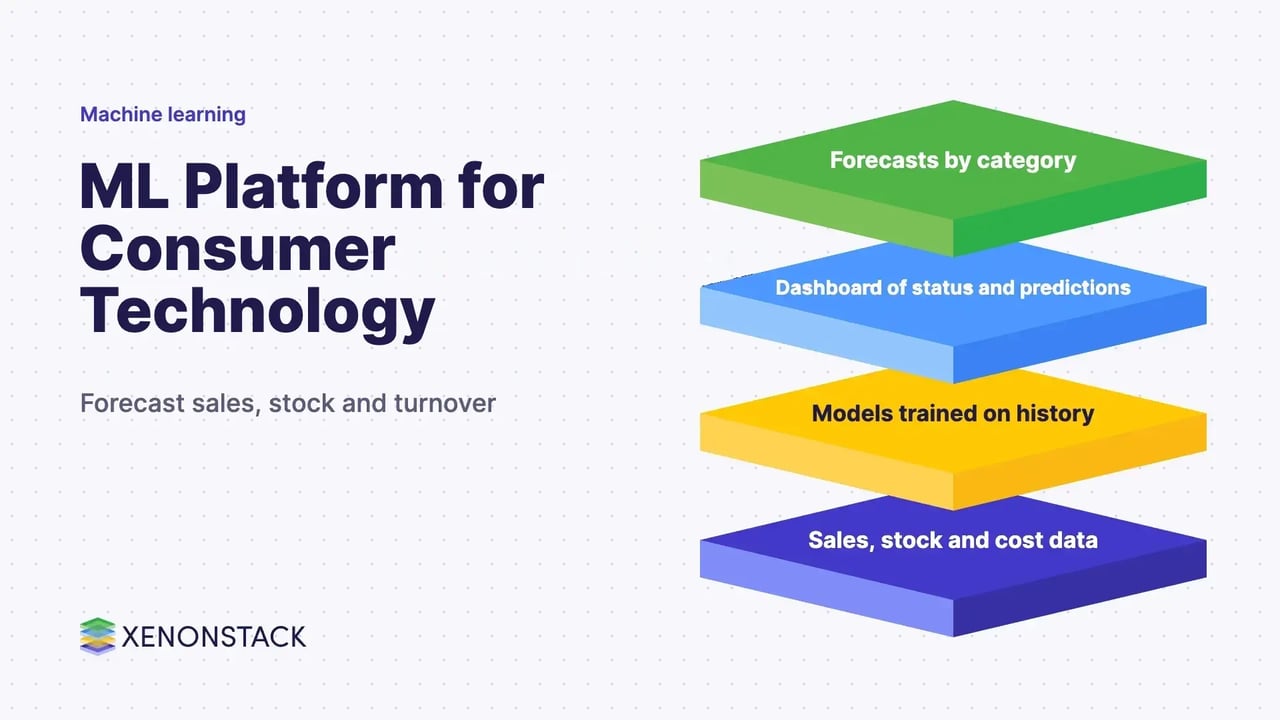
XenonStack's ML services are used to build models on real-time data. The platform follows a simple sequence.
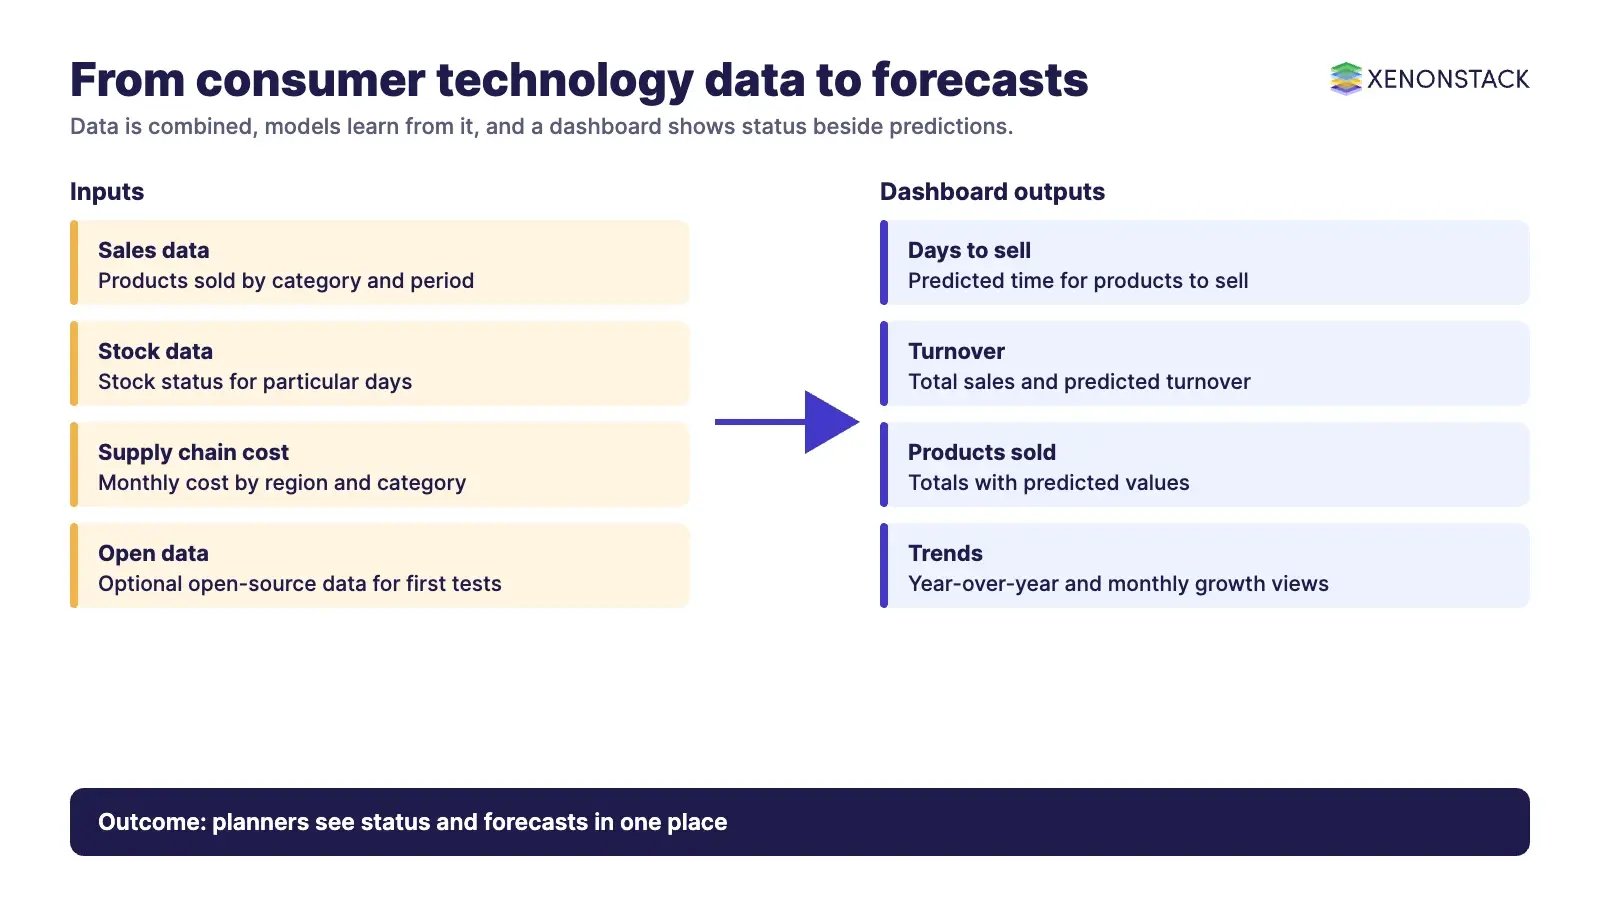
- Bring the data together. Sales, stock, category and supply chain cost data from different regions is collected into one dataset.
- Train models. Models learn from that history to understand customer needs, the status of sold products, the number of days items take to sell and turnover across categories.
- Present results in a dashboard. Users see current status next to predicted values for products sold and sales.
- Test on open data. Teams can start with open-source data from production companies, check its data types and apply the model to see results before connecting their own systems.
The dashboard covers days to sell, stock status for particular days, monthly supply chain cost, total sales turnover and total products sold, with predicted values alongside them by category.
Why is forecasting hard to get right?
A Bain article on demand forecasting with advanced analytics makes several points worth planning around. Better data is probably the single most important investment. Expect many models rather than one, matched to the type of product. Sophistication does not always pay off, and users will not rely on a model they do not understand. Bain also notes that underordering is more expensive than overordering, so consistent accuracy near the stock limit matters as much as average accuracy.
How does it compare with manual reporting?
| Question | Manual spreadsheet reporting | ML analytics platform |
|---|---|---|
| Data freshness | Refreshed when someone rebuilds the report | Built on real-time data feeds |
| Looking ahead | Trend lines extended by judgement | Predicted days to sell, sales and turnover by category |
| Year-over-year views | Assembled per request | Standing dashboard views of trends and monthly growth |
| Supply chain cost | Separate files by region | Shown with sales and stock by region and category |
| Trust and review | Formulas live in individual files | Models and inputs can be reviewed and versioned |
Where do AI agents fit in consumer technology analytics?
A forecast only helps when someone acts on it. AI agents can watch the dashboard signals, such as a category with slowing sales or rising stock, and prepare the follow-up for a planner to approve, for example a review of reorder levels. The agent still needs defined data access and clear approval steps.
ElixirData, XenonStack's Context OS, is the data and governance side of that setup. You can also request a demo of the machine learning model to see the dashboards.
What should you check before adopting one?
- Data quality. Check that sales, stock and cost data are complete and consistent across regions and categories.
- Definitions. Agree what counts as a sale, a return and days to sell before training anything.
- Explainability. Choose models your planners can question and understand.
- Benchmarks. Compare model output with a simple baseline so you know it adds value.
- Ownership. Name who maintains the data pipeline and who reviews forecasts.
To map one decision your agents make, and the data and policy it depends on, book a Context Workshop. See what happens in the workshop.
Frequently asked questions
What does a machine learning platform for consumer technology do?
It learns from sales, stock and supply chain data to show the status of sold products and predict days to sell, sales and turnover by category.
What data does it need?
Sales, stock, category and supply chain cost data by region and period. Teams can test the approach on open-source data first.
How is it different from a standard dashboard?
A standard dashboard reports what happened. This platform adds predicted values alongside the current status.
Why does data quality matter so much?
Bain describes better data as probably the single most important investment in demand forecasting, because models can only learn from what they are given.
Can I see a demo?
Yes. You can request a demo of the machine learning model from XenonStack through the specialist request form.
Ready to put AI agents to work? See an ElixirClaw demo: the agentic OS to build, orchestrate and govern AI agents across your enterprise systems.
Explore the XenonStack platform family: ElixirData · ElixirClaw · ElixirHub · NexaStack · MetaSecure · Neural AI · AgentGRC · AgentSRE · AgentAnalyst · AgentInstruct · AgentRAI · AgentScrum · AgentSearch · AgentForce · AI Aviator · SAIF Aviator · CohortIQ · XenonStack AI · XenonStack UAE