Key takeaway
- Workplace analytics explained: what it measures, benefits, video-based use cases, Microsoft Viva Insights and the privacy checks to do first.
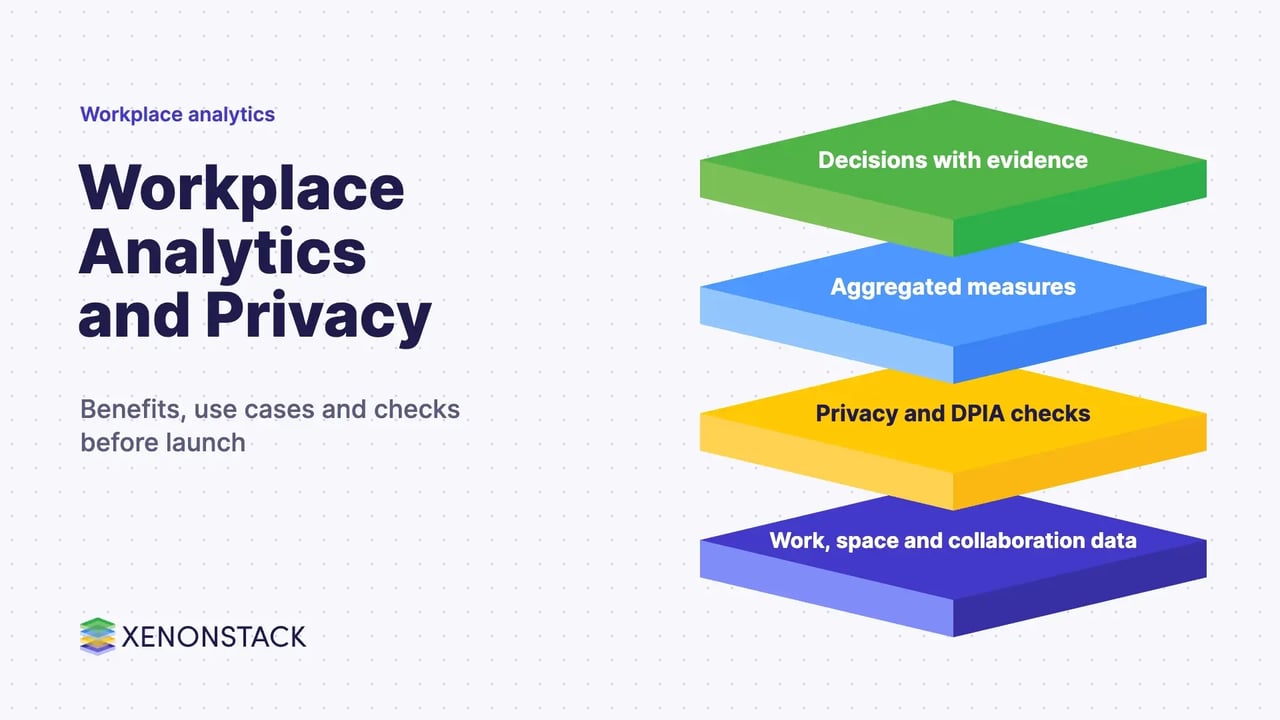
Workplace analytics is the practice of using work data to see how time, space and collaboration are really used, so that leaders can change schedules, layouts, safety rules and processes with evidence instead of opinion. It comes in two forms: collaboration analytics from tools such as Microsoft Viva Insights, and sensor or video analytics for buildings and sites. Both only work when the data is aggregated, the purpose is stated, and employees are told what is measured.
This guide explains what workplace analytics measures, the benefits and limits, worked scenarios from a video-based building dashboard, and the privacy checks to complete before launch. For the wider technology, see our guides to video analytics use cases and the intelligent video analytics platform.
What is workplace analytics?
Workplace analytics turns operational data about people and places into measures a manager can act on: how many people visit a site, when areas become crowded, how meetings and focus time are balanced, and where delays interrupt work. The aim is to find avoidable friction and safety risk, then test a change and measure again.
| Type | Data used | Typical question | Main risk to manage |
|---|---|---|---|
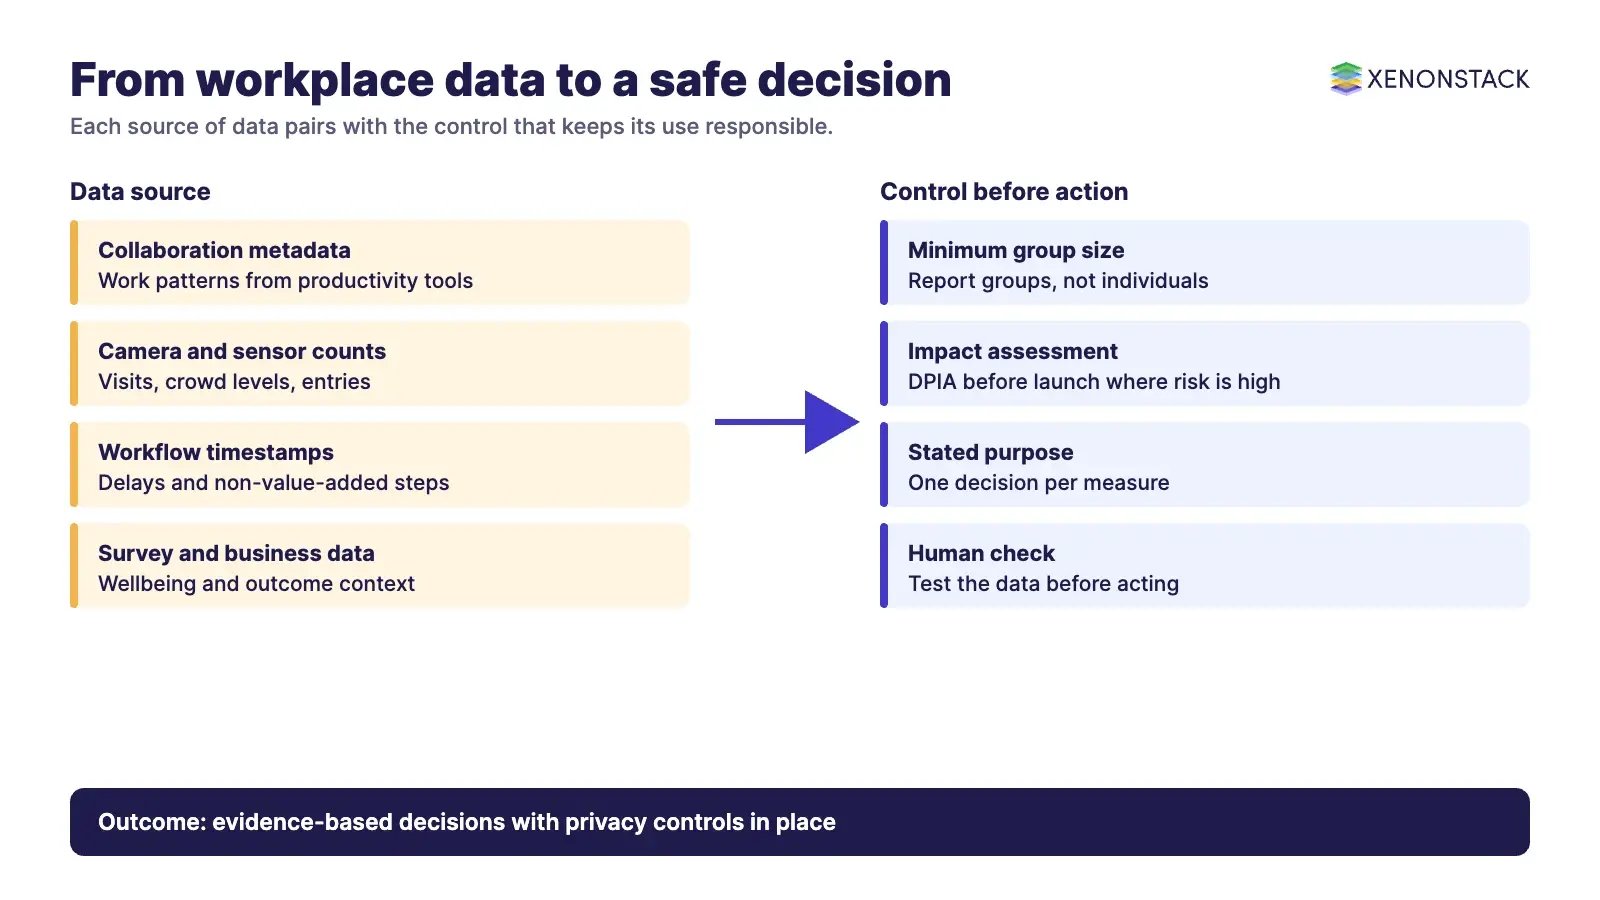
| Collaboration analytics | Work-pattern metadata from productivity tools, plus organisational, business and survey data | Is the team protecting focus time and wellbeing? | Individual-level monitoring, small groups |
| Space and safety analytics | Counts and events from cameras or sensors | Where does a crowd or an unauthorised entry build up? | Identifying people, scope creep |
| Process and productivity analytics | Timestamps from systems and workflows | Where do delays and non-value-added steps sit? | Measuring activity instead of outcomes |
What is productivity analytics?
Productivity analytics uses the collected data to find where improvement projects are worth running and where delay or interruption causes loss. Reliable data lets a team do three things: set clear productivity goals, phase out activity that adds no value, and estimate the likely saving before committing budget.
What are the benefits of workplace analytics?
| Benefit | What it means in practice | When it fits |
|---|---|---|
| Evidence-based decisions | Schedules and layouts change because of observed patterns, not myths. | Shared sites with several tenants or teams |
| Safety and crowd awareness | Thresholds for people counts raise an alert before an area becomes unsafe. | Canteens, lobbies, plants, event spaces |
| Security | Unusual entry patterns are flagged for review. | Controlled buildings and restricted zones |
| Wellbeing and focus time | Leaders see whether work-life balance and hybrid work are holding up. | Large hybrid organisations |
| Faster, more consistent decisions | One set of agreed measures replaces ad hoc reports. | Facilities, HR and operations reviews |
The limits matter as much. Analytics shows patterns, not causes, so every finding needs a person to check it, and a measure that is unreliable should be fixed before anyone acts on it.
How does Microsoft Viva Insights approach workplace analytics?
According to Microsoft Learn, Viva Insights gives analysts advanced analysis tools: they run predefined or custom Power BI queries on the Create analysis page and share results with leaders through Publish reports. The same page describes research-based insights on work-life balance, employee wellbeing and the effects of hybrid work, and reports on how employees use Microsoft Copilot.
Admins supply organisational data, business outcome data and survey data imported from Viva Glint. Managers see organisation insights in the Viva Insights app in Teams, controlled by the admin through manager settings. Microsoft Learn states that the tools are available at varying levels across Microsoft 365 and Office 365 plans, so confirm your entitlement on the official page before planning a rollout.
Microsoft also documents privacy controls: admins can set the minimum group size, block sensitive keywords from appearing where Viva Insights data is used, and let end users opt out of personal insights and person queries. Microsoft Learn also notes that the organisational behaviour insights reports in the Teams app are no longer available, and points analysts to the Publish reports feature for collaboration insights. Product names and features change, so confirm the current state on the official page.
What are the use cases of video-based workplace analytics?
The scenarios below are illustrative examples of how a building owner might read a video surveillance dashboard. They show the habit that matters: read the chart, form a hypothesis, then check before acting. The measures are total visits, total unauthorised visits, the unauthorised visit schedule, unauthorised against authorised visits, and crowd management.
| Measure | What the owner notices | Recommended action |
|---|---|---|
| Total visits | Visitor numbers change sharply in one month with no seminar, conference or other event. | Check whether a tenant held an event without permission, and confirm the system is counting accurately. |
| Total unauthorised visits | Unauthorised entries rise in the same period. | Tighten access control and run briefings for visitors in those months. |
| Unauthorised visit schedule | Unauthorised entries jump on Tuesdays because several tenants schedule interviews that day. | Agree with tenants to spread interviews across the week. |
| Unauthorised against authorised visits | Unauthorised visits exceed authorised visits every day, which does not match what tenants report. | Treat it as a data fault: review the model with an explainable AI dashboard and ask for maintenance if needed. |
| Crowd management | The canteen goes well above its agreed people count at 11:00 because tenants share the same break time. | Agree staggered break slots by group. |
The fourth row is the important lesson: when a result looks impossible, test the data before blaming the people. Our AgentAnalyst lets teams ask questions of enterprise data in plain language and get real-time insights, which helps non-specialists test a chart like this without waiting for a report.
How do you adopt workplace analytics responsibly?
Start with one decision, not with the data. Name the decision, choose the smallest measure that informs it, and write down who may see the result. Then work through the privacy and governance checks below.
| Step | What to do | Why it matters |
|---|---|---|
| 1. State the purpose | Write the decision the data will inform. | GDPR Article 5 sets purpose limitation and data minimisation principles (confirm the wording on the official page). |
| 2. Assess the risk | Run a data protection impact assessment before launch where processing is likely to be high risk. | Article 35(1) requires an assessment before processing where it is likely to result in a high risk to rights and freedoms, and Article 35(3) names systematic and extensive evaluation of personal aspects and large-scale systematic monitoring of a publicly accessible area. |
| 3. Aggregate | Report groups, not individuals, and set a minimum group size. | Reduces the chance of identifying a person. |
| 4. Tell employees | Explain what is measured, why and for how long. | Employment-context rules differ by country (see GDPR Article 88, confirm on the official page). |
| 5. Check workplace-specific AI rules | Review the EU AI Act provisions on AI used in the workplace before using emotion or biometric inference (confirm on the official page). | Regulation (EU) 2024/1689 has specific rules here; get legal advice. |
| 6. Review and retire | Review each measure on a schedule and drop those that no longer inform a decision. | Keeps scope from growing quietly. |
This is general information, not legal advice. Employment and data protection rules vary by country, so confirm each point on the official pages and with your counsel.
When should you not use workplace analytics?
When the question can be answered by asking people directly.
When the measure would rank or discipline individuals from raw activity data.
When the group is too small to report without identifying someone.
When no one has agreed in advance what action a result will trigger.
How does governed context help workplace analytics?
Analytics that drive actions need a record of which data, policy and approval stood behind each decision. ElixirData Context OS keeps governed context, versioned policy and decision traces in one decision layer above AI agents, and ElixirClaw is an agentic OS platform to build, orchestrate and govern AI agents and automation workflows while keeping humans in control.
To map one workplace decision your agents should make, and the context and policy it depends on, book a Context Workshop. See what happens in the workshop.
Frequently asked questions
What is workplace analytics in simple terms?
It is the use of work, space and collaboration data to understand how a workplace operates, so leaders can change schedules, layouts and safety rules based on evidence.
Is workplace analytics the same as Microsoft Viva Insights?
No. Viva Insights is one product that offers collaboration and work-pattern analysis. Workplace analytics is the wider practice, which also includes sensor and video analytics for sites and buildings.
Can workplace analytics identify individual employees?
It should not be used that way by default. Microsoft Learn describes admin controls for minimum group size and for opting out of personal insights. Whatever tool you use, report groups and complete a data protection impact assessment where required.
Do we need a data protection impact assessment?
GDPR Article 35(1) requires one before processing that is likely to result in a high risk to the rights and freedoms of people. Article 35(3) lists systematic and extensive evaluation of personal aspects as a case. Confirm applicability with your counsel.
What should we do when a dashboard result looks wrong?
Check the data first. In the dashboard scenario above, unauthorised visits exceeding authorised visits every day pointed to a system fault, so the owner reviewed the model and asked for maintenance.
Explore the XenonStack platform family: ElixirData · ElixirClaw · ElixirHub · NexaStack · MetaSecure · Neural AI · AgentGRC · AgentSRE · AgentAnalyst · AgentInstruct · AgentRAI · AgentScrum · AgentSearch · AgentForce · AI Aviator · SAIF Aviator · CohortIQ · XenonStack AI · XenonStack UAE