
.webp?width=1921&height=622&name=usecase-banner%20(1).webp)
Introduction to AI in Auto Insurance Claim
The main Objective of AI in Insurance Claim prediction is to predict the probability that a person will crash their car and then the amount of money it will cost if the person does crash their vehicle.
AI in Insurance Claim Prediction is a process in which a customer wants an explanation if their Claim is rejected, such as why his Claim is rejected and what factors his Claim gets denied?
Akira AI improves the end customer and the insurance industry's experience by providing Explainable AI in Insurance Claim Prediction AI systems. It provides a responsible, explainable, flexible, human-centered, transparent, and fair system.
Explainable AI increases AI systems' adoption and helps the insurance industry grow and bring better outcomes for their customers with AI Insurance. - Explainable AI in Insurance Industry
End Customer Perspective
For decision-makers, explainability is a serious concern. Numerous questions come to the customer's mind when they know that the System rejects their Claim. If the System would not explain or justify its decisions, it can affect customer trust. Akira AI provides Explainable AI with its System that improves customer satisfaction. Some of these questions are below.
Questions
-
Which model is selected, and why is that selected? Is it offering the best trade-off in terms of accuracy vs. explainability? Is it possible to enhance model explainability without damaging performance?
-
Is this System transparent or opaque?
-
Which parameter influences the result more?
-
How does system output vary by change in the value of the last five years' claims?
-
How does the System predict that a person was not in a car crash?
-
What is the Claim's frequency that I need to have so that the application will not get rejected by the System?
-
What is the rule that the System uses to make decisions?
Solutions
Akira AI provides Explainable AI using various frameworks and methodologies to answer those questions. Explainable AI helps answer all the customer's questions and offer a transparent and interpretable system. There is a list of methods that can be used to answer this question. These are given in the following table:
| Questions of Stakeholder | Methodology to be used |
|---|---|
|
Is it possible to enhance model explainability without damaging model performance? |
Model accuracy vs. Model Explainability |
|
What is the Influence of features on model output? |
SHAP(Shapley Additive exPlanations) |
|
How model output varies by changing the value of the particular feature? |
PDP(Partial Dependence Plot)/ICE(Individual Conditional Expectation) |
|
What is the value of the claim frequency needed to have? |
Anchors |
|
What is the general rule that the System uses to predict that the car is in a crash? |
defragTrees(For random forest) |
Table 1.1
Implementation of Explainable AI in Insurance Claim Prediction
To implement AI in Insurance Claim Prediction methodologies, we have various packages and libraries that help to answer the customer's queries:
Methodology
|
Insurance |
|
|
Model accuracy vs. Model Explainability |
Python and Visualization |
|
SHAP |
Using SHAP library |
|
PDP/ICE (Individual Conditional Expectation) |
PDP box |
|
Anchors |
Anchors from Alibi |
Table 1.2
Explainable AI in Insurance Claim Prediction and Predicting Car Crash
Q1:- Which feature influences the System that the car was in a crash?
The contribution of features in making decisions can help insurers and customers to trust results.
Figure1.4 depicts the importance of the features in predicting the output. Features are sorted by decreasing the importance from top to bottom to generate the output.
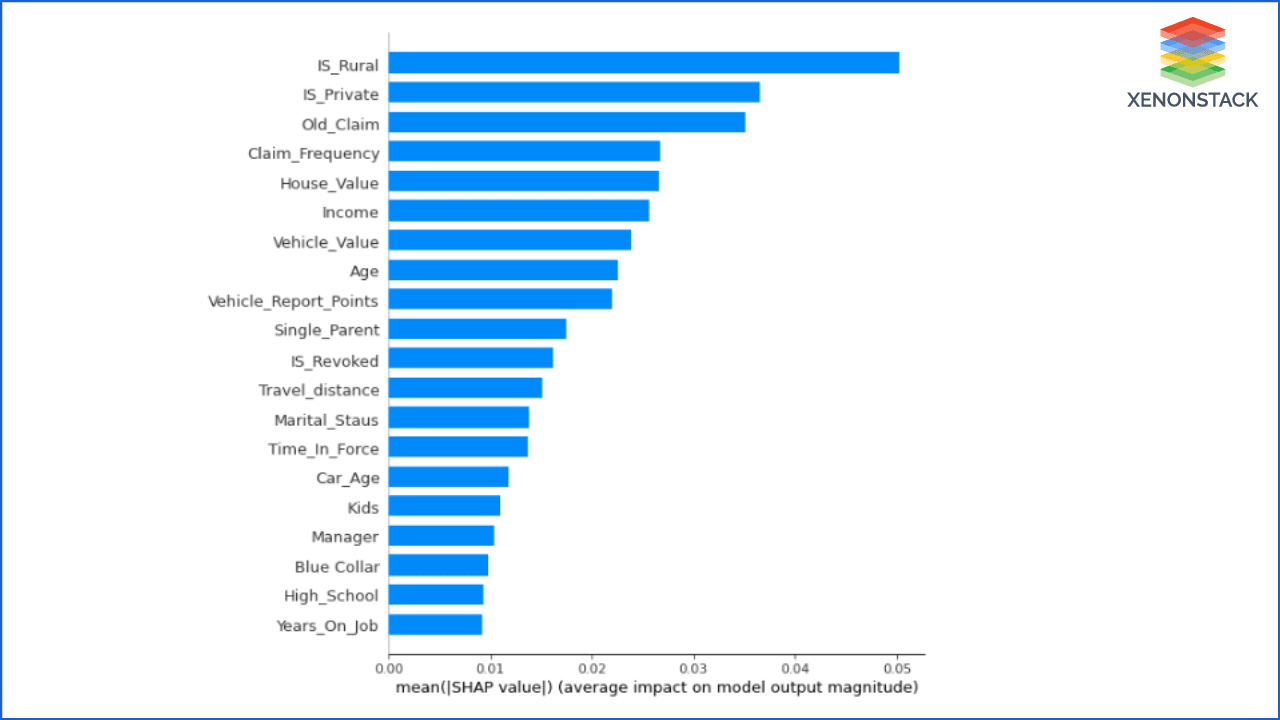
Figure 1.4
As shown, the car's area influences the result more while predicting whether the car can be in a crash or not. IS_Rual parameter has a categorical value: whether it can be in Rural or Urban.
Q2:- How is data contributing to making a decision?
This is the next version of the previous graph. It also shows the same things with some more information about the feature's value.
-
Feature Importance: Variables are ranking in descending order of importance.
-
Impact: The horizontal location shows whether the effect of that value is associated with a higher or lower prediction.
-
Value: Color shows whether that variable is high or low for that observation. Red color devotes the high deal and blue for less weight. The variation in color of the dot shows the value of the feature.
-
Correlation: The first parameter of Figure 1.5 depicts that the cars moving in the Rural area have fewer chances to crash than the cars moving in the Urban area.
Old Insurance Claim parameters also influence the result. Its value is positively correlated with the car crash.
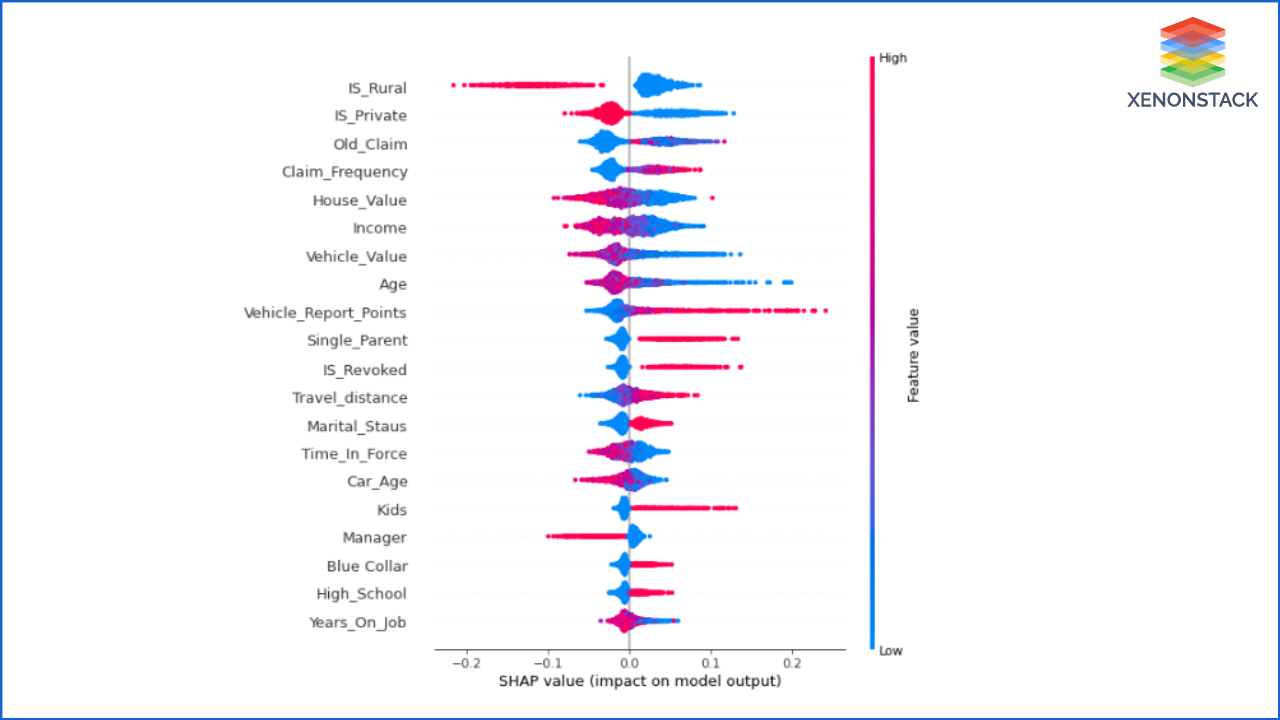
Figure 1.5
Q3:- How do old insurance claims of a person change the system output?
After getting the answer to the first question, the customer can ask for an old insurance claim. How the change in the value of the past claims changes the system output when other parameters are not changing?
To answer this, let's discuss the Partial Dependence Plot (PDP)
PDP shows the relation between the target response and feature. Other features are marginalized. This graph shows how a change in the value of Insurance Claims changes the predicted output. It depicts that the increase in Insurance Claim's value increases the probability of having a car crash.
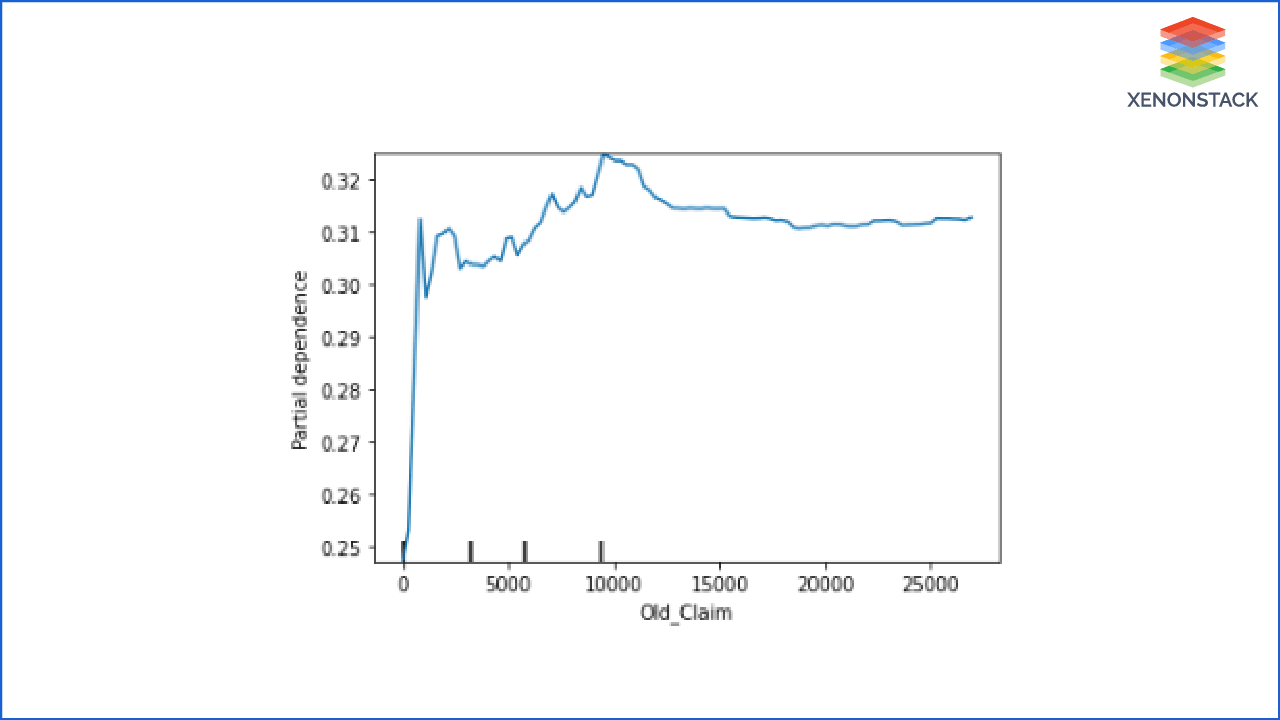 Figure 1.6
ICE (Individual Conditional Expectation) is a more detailed view of PDP. ICE is used to inspect the model's behavior for a specific instance, where everything except Claims is held constant, fixed to their observed values. Simultaneously, the Insurance Claim is free to attain different values.
In PDP, other features are averaged out, but it took each case individually and the plot graph by only changing salary and remaining others constant. So this is a broad view of PDP.
In FIgure 1.7, we just selected some of the observations. Users are free to choose any number of observations they want to explore. 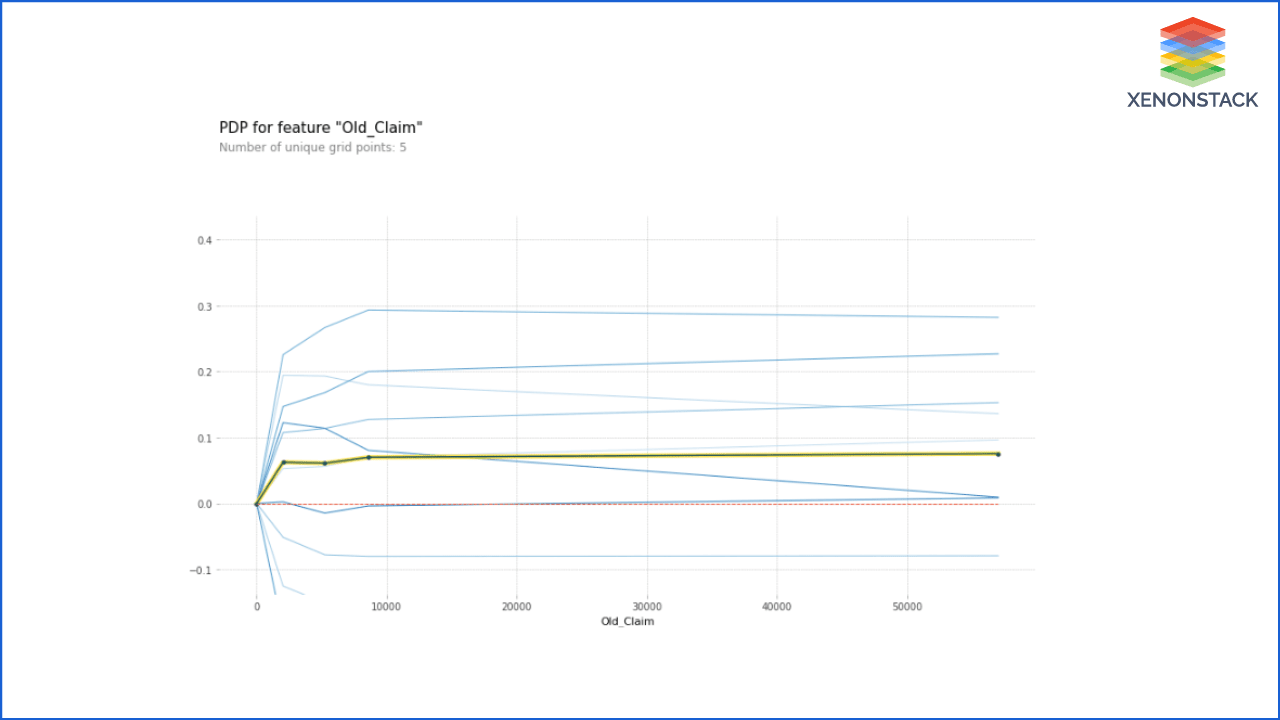
Figure 1.7
Q4:- Why did the System say Mr. John's car did not crash?
Customers will always be eager to know if the AI System predicts that this case is not a car crash, so the Insurance Claim will not be provided to the customer.
Using SHAP system plots and justify its result is why it chooses individual output. The SHAP value represents the impact of feature evidence on the model's production. The waterfall plot depicts how each feature's SHAP values move the model output from our prior expectation under the background data distribution to the final model prediction. It gives evidence of all the features.
It displays explanations for individual predictions, so they expect a single row of an Explanation object as input. Each row shows how the positive (red) or negative (blue) contribution of each feature moves the value from the expected model output over the background dataset to the model output for this prediction.
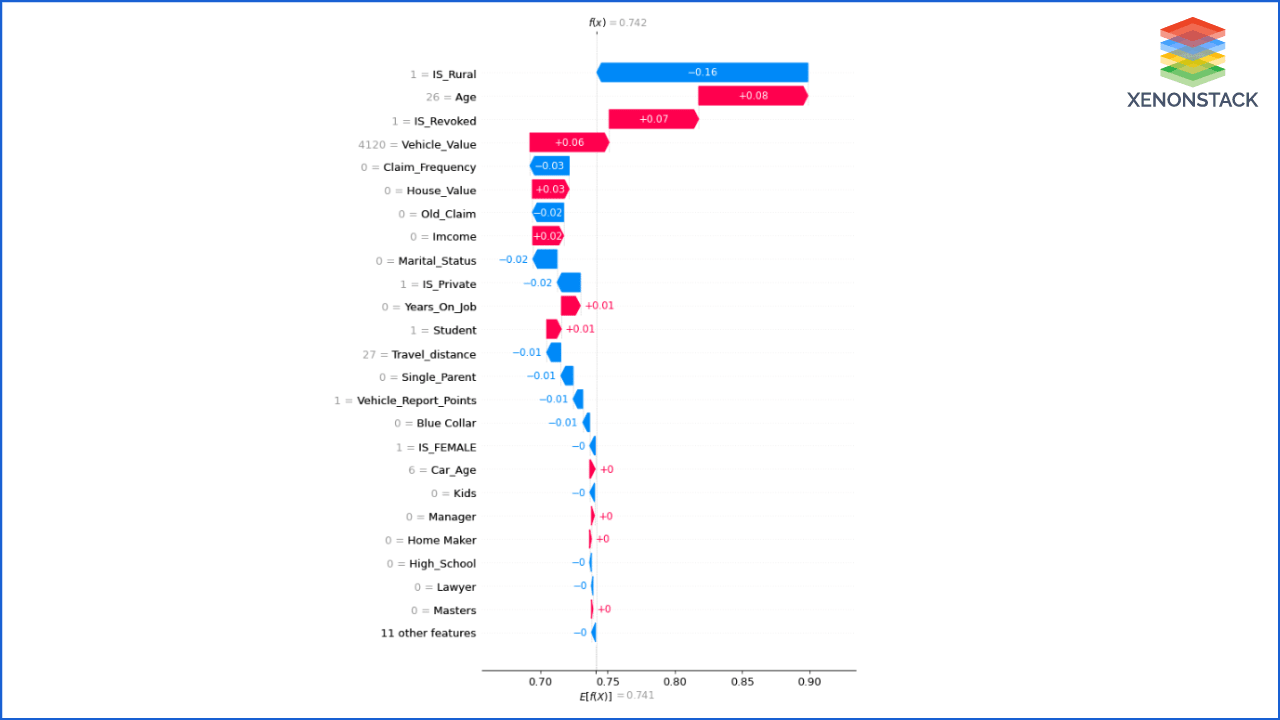
Figure 1.8
Q5:- Mr. John and Mr. Brehmi have almost the same values of parameters, then why does the AI System predict that Mr. Brehmi was in a car crash, and Mr. John was not?
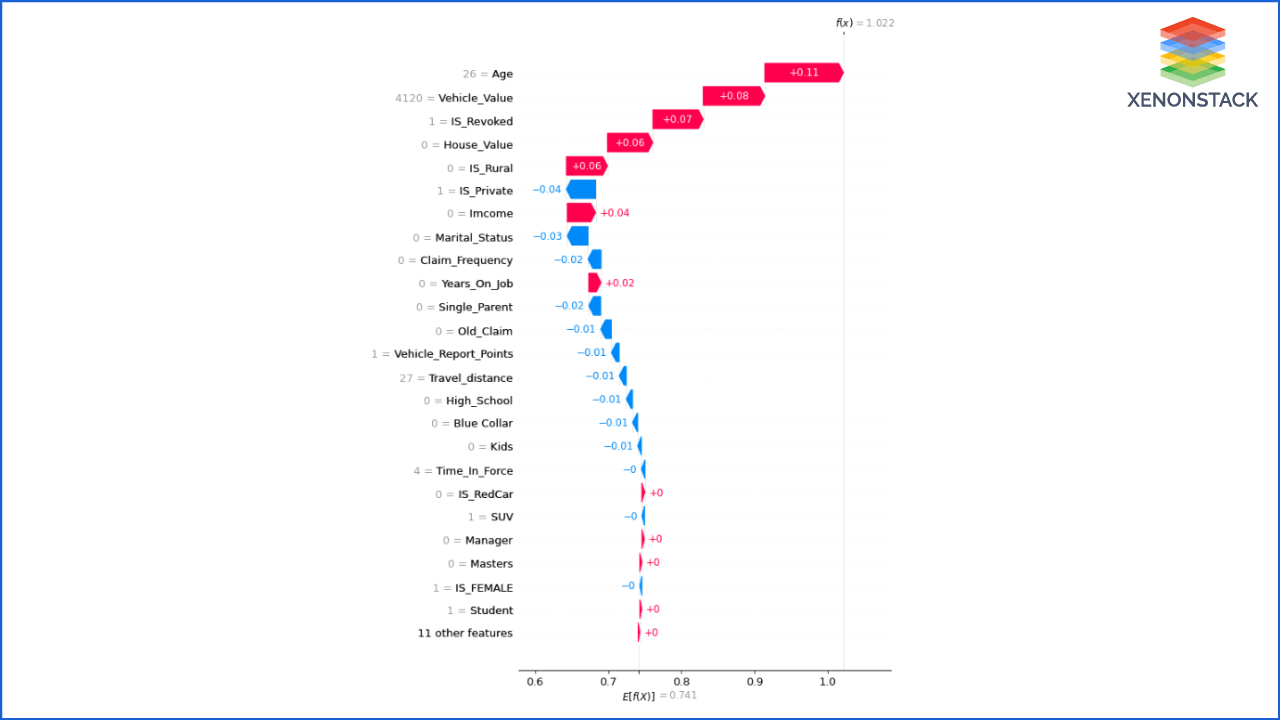
Figure 1.9 Model Justification for Mr. Brehmi
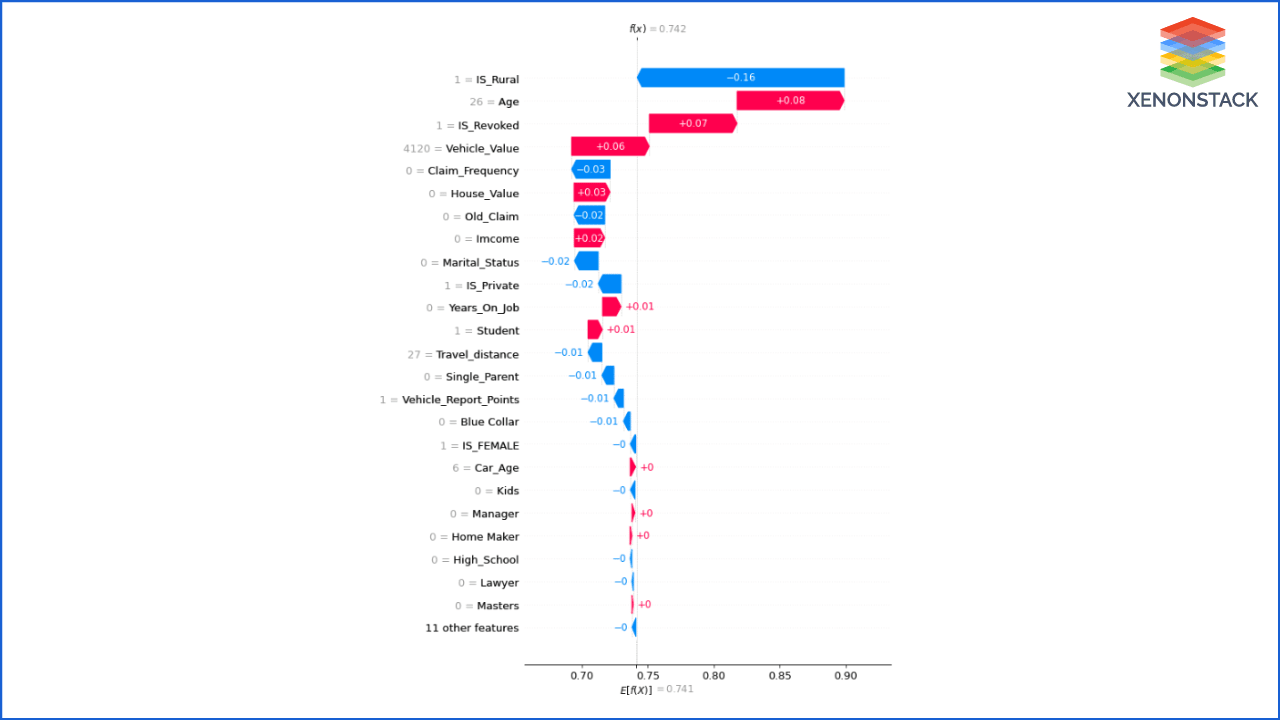
Figure 1.10 Model Justification for Mr. John
Q6:- Both Mr. John and Mr. Brehmi have the same values; therefore, Mr. John asks how the System can say that Mr. John's car was not crashed and Mr. Brehmi's car was in a crash?
They both have the same car type, traveled distance occupation, etc. To answer this question, Explainable AI uses a waterfall chart of SHAP. If we check waterfall graphs for Mr. John and Mr. Brehmi, it tells us that the parameters that change the model's decision are 'IS_Rural' that tells the area in which they are traveling. John is traveling in the Rural area, and there are significantly fewer chances that cars will crash, and Brehmi is traveling in the Urban area where the chances of errors are more.
The insurance industry and customers are affected due to fraud reports and fraud insurance accounts for property and casualty losses - Use Cases of Blockchain for Insurance Industry
Q7:- After predicting the Car crash, how System indicates the claim amount?
The features that contribute to predicting the Insurance Claim amount given in the following two figures. Figure 1.11 shows the importance of those features, and Figure 1.12 shows how the values of features influence the Insurance claim amount.
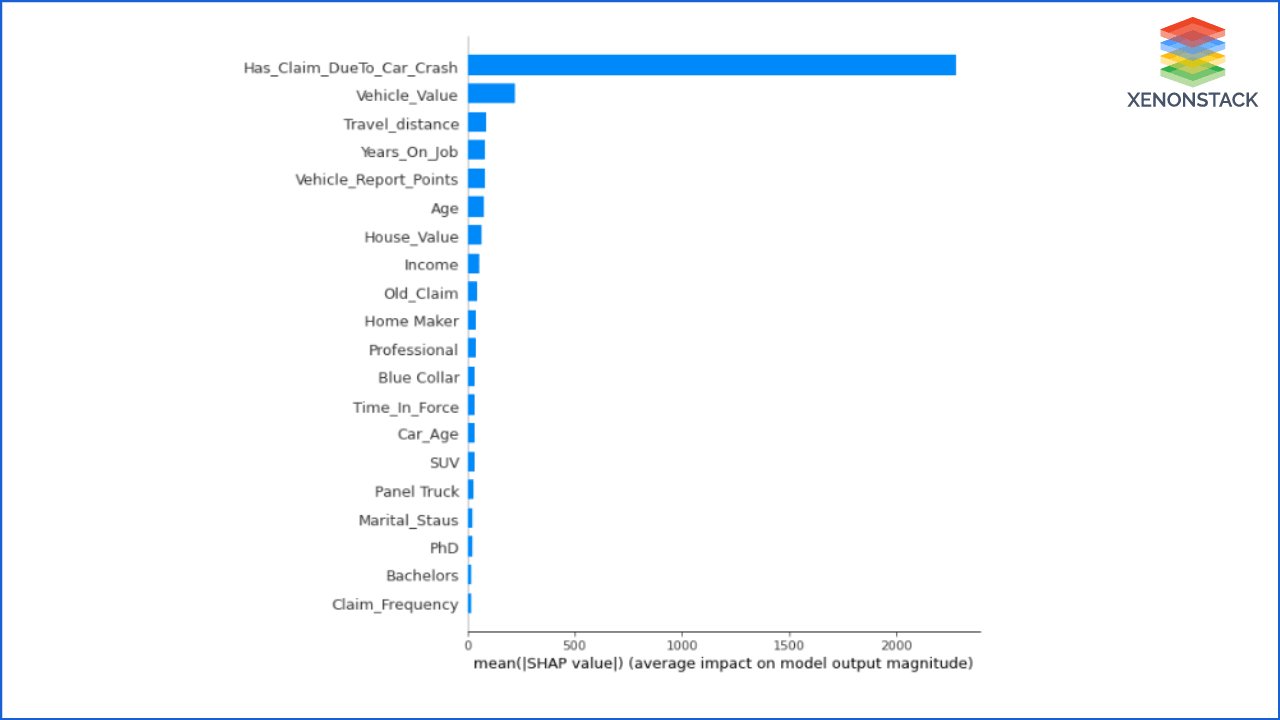
Figure 1.11
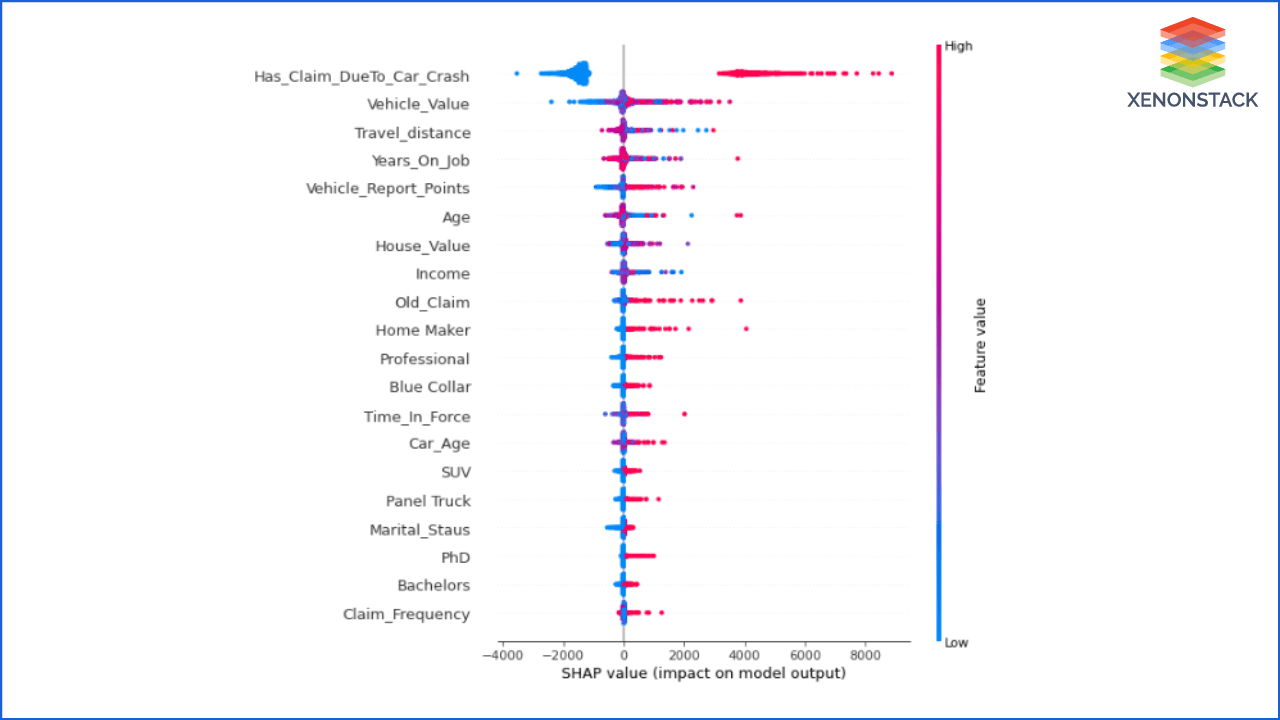
Figure 1.12
Q8:- How do Insurance Claim amounts increase or decrease based on the Car price?
Figure 1.13 shows how a change in car price changes the claim amount. As the car price is increasing, the amount of claims is also going to be increasing.
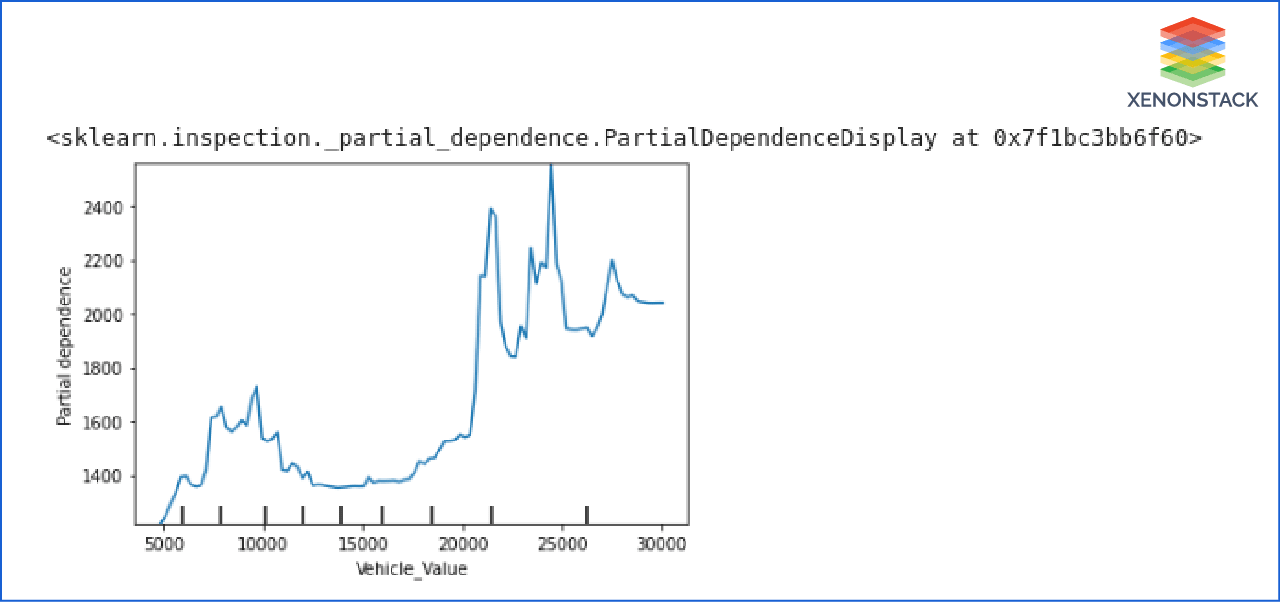
Figure 1.13
Q9:- Mr. Denial and Ms. Soofi have almost the same values of parameters, then why the System predicts to give more Insurance Claims amounts to MR. Denial?
Both Mr. Denial and Ms. Soofi have the same values for the attributes, but the AI System predicts to give more Insurance Claim amounts to Mr. Denial; therefore, Ms. Soofi asked why the AI System gives more amount to Mr. Denial?
To answer this question, Explainable AI uses a waterfall chart of SHAP. Suppose we check waterfall graphs for Mr. Denial and Ms. Soofi. In the charts, we can see that the result changes only because of the vehicle value. The price of their cars is different; therefore, the claim amount provided to them is also additional.
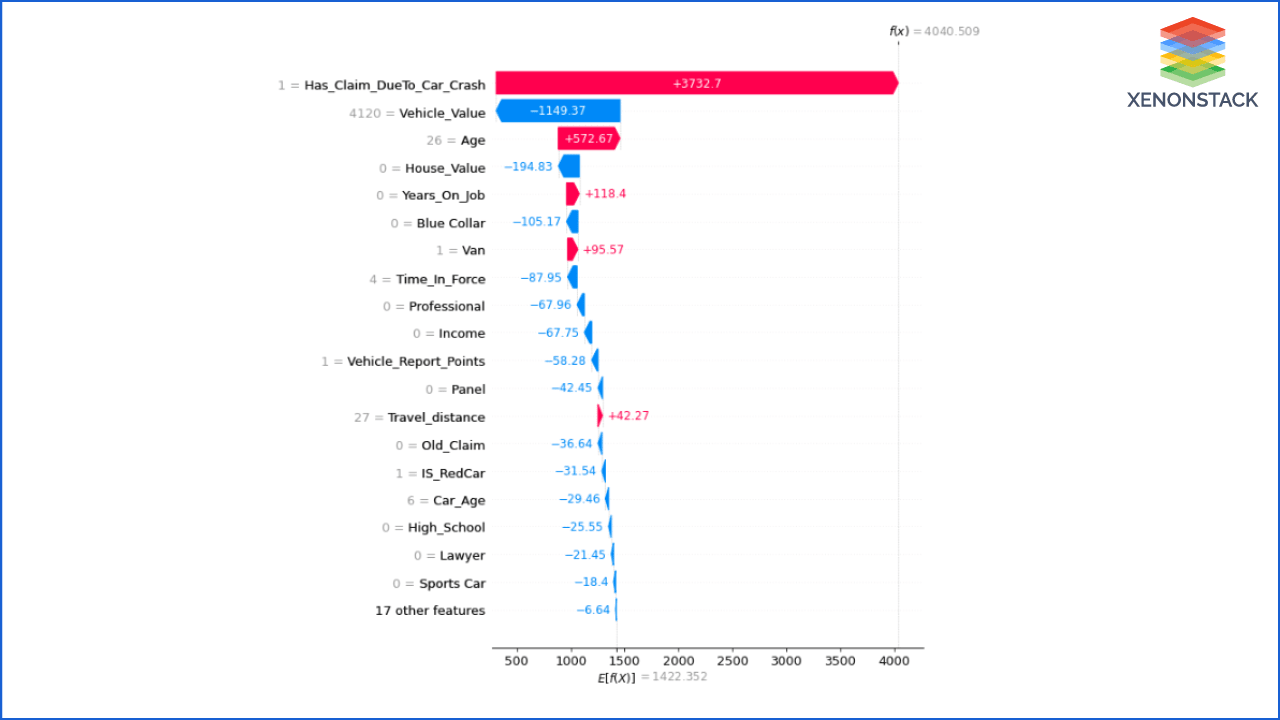
Figure 1.13 Mr. Denial's Justification chart
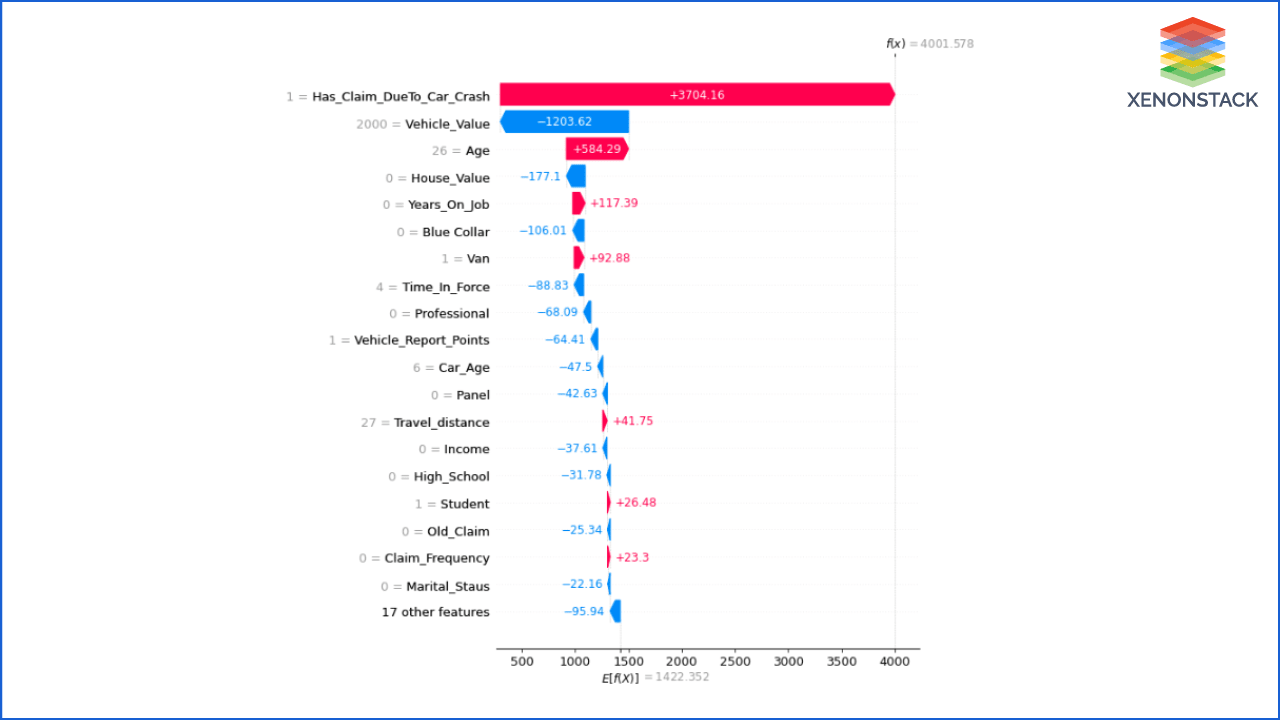
Figure 1.14 Ms. Soofi's Justification chart
Conclusion
Explainable AI in Insurance Claim Prediction an excellent approach to gain customer's trust and confidence. It makes the AI System more trustable and interpretable. With this approach, we can make the AI System more productive by tracking performance, fairness, errors, data, etc.
- Explore here What is MDM Insurance?
- Discover here about Insurance Analytics Challenges and its Solutions


