Overview of Manufacturing Data Analytics Platform
In the Manufacturing sector, the customer's primary requirement is to get the organization's status, like their turnover, how many workers are there in real-time, and support clients' needs. Today's customers see the working status of their organization along with their production. Here the customer needs a year-to-year trend analysis to get the insights related to sales revenue, their monthly growth, year to year comparison before concluding. Therefore Manufacturing Data Analytics Platform is necessary to compete in the manufacturing industry.Solution for Manufacturing Data Analytics Platform
- With Xenonstack Support, one can build accurate ML models in real-time for Manufacturing Analytics solutions. To better understand the customer for getting the organization's information and their turnover, product status, and labor costing through the model.
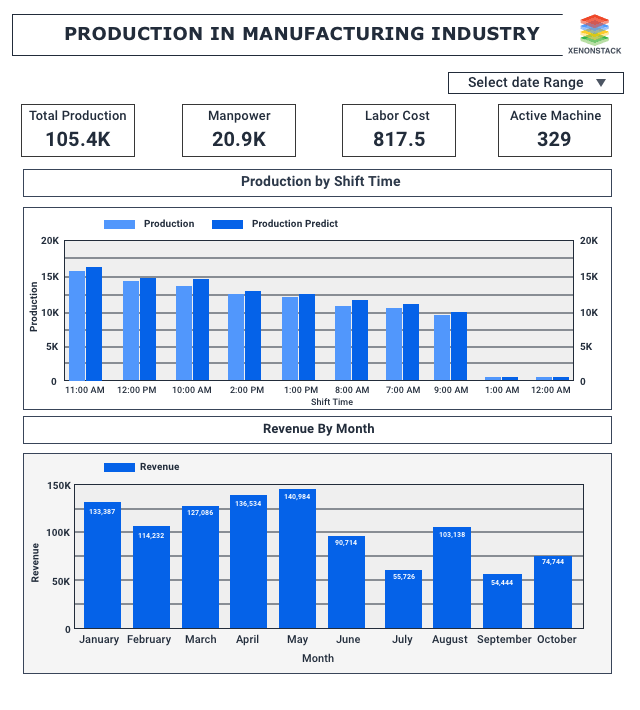
- We can see the production details on every hour of the day with their labors status; by applying the model, the user will easily understand them. Here data sources will generate from the production-based companies.
Why XenonStack?
Click on a button and request us to give you a demo of our machine learning model. Here you will get insights related to total production labor cost and manpower. Our model will provide you with an accurate prediction of the manufacturing industry with their production analysis. By applying Machine Learning models, the users will get an accurate model for getting their organization's status and turnovers their productions with narrative addition.Dashboard
Description of Manufacturing Analytics Dashboard
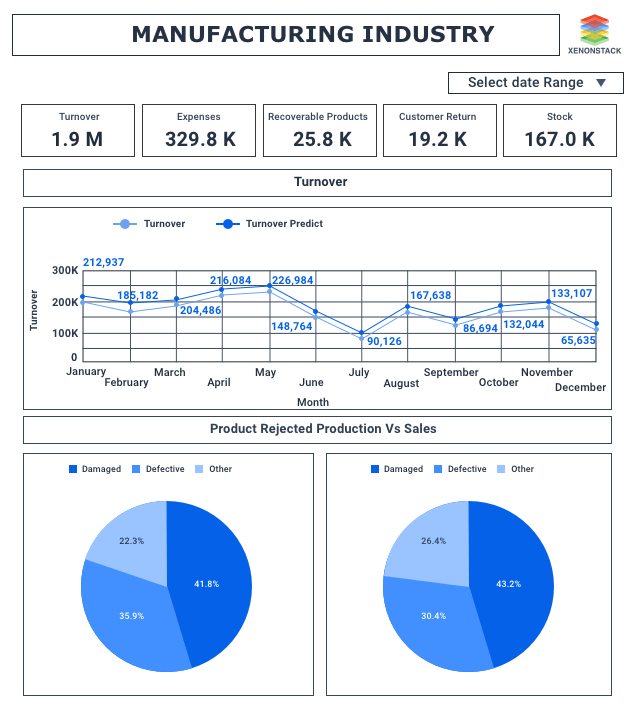
Listed below are the benefits of the Manufacturing Analytics Dashboard.- Here our dashboards show the organization does the total production and their sales revenue and active machines status. So here we can see the organization turnover of 1.9 Million, their manpower status, their labor cost, and customer return of their products.
- The total stock of the products in the organization, here users will also get to know about the products rejected production vs. sales.
- Here maximum % is for damaged products in both cases sales and production. Here, users will also see the production based on shift timings. Where users will get the predicted result for industry turnover and production on shift timing.


Thanks for submitting the form.